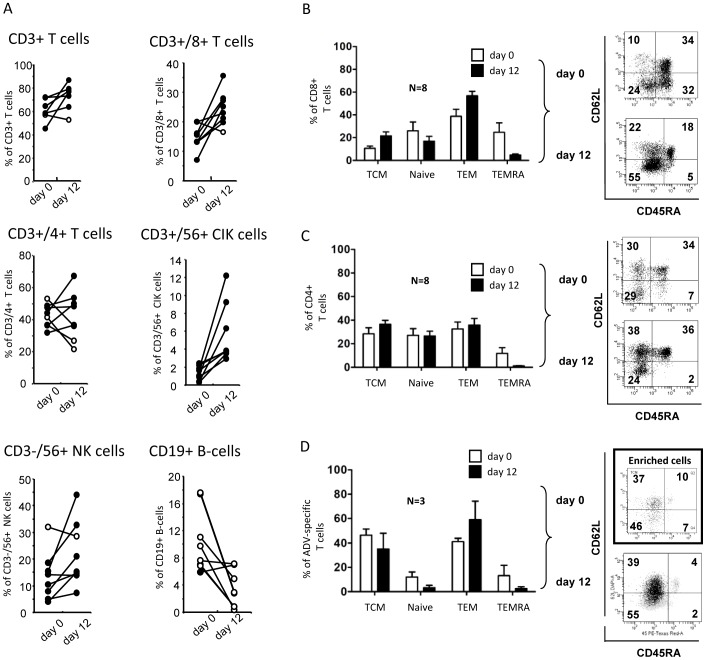
Figure 4. Phenotypic analysis of seHAdV-T-cells.
A) Percentage values of different cell populations (as indicated, including cytokine-induced killer cells (CIK)) within PBMCs, before (day 0) and after expansion (day12) of 8 donors. Percentage values of TCM (upper left), Naïve (upper right), TEM (lower left) and TEMRA (lower right) T cell populations within CD8+ (B), CD4+ C), and HAdV-streptamer+ T-cells D) on days 0 (white bars) and 12 (black bars). The graph shows mean+SEM of 8 (for CD4+ and CD8+ T-cells) and 3 (for HAdV-streptamer+ T-cells) donors. Notably, for phenotypic analysis of HAdV-streptamer+ T cells on day 0 (white bars), beads-based magnetic isolation was performed. Representative dot plots are shown.

