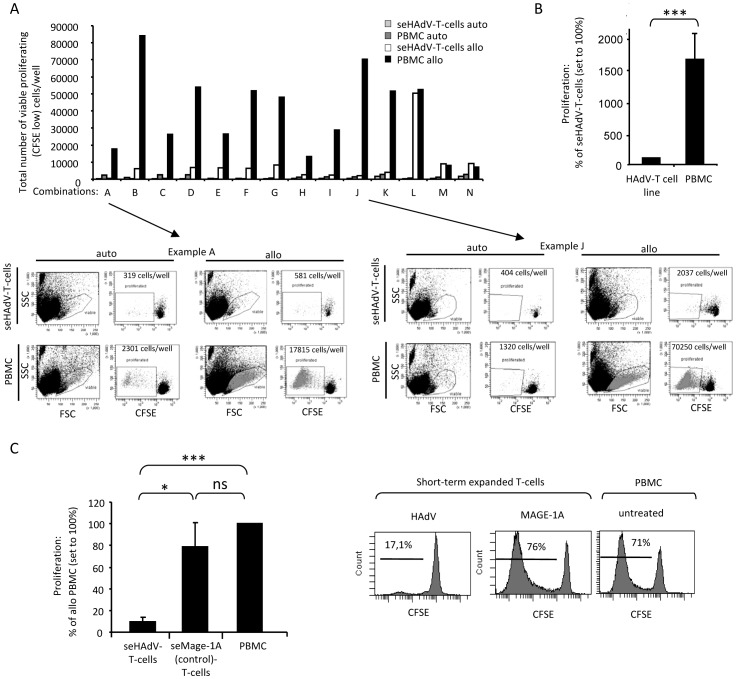
Figure 5. Alloreactive potential of PBMCs versus expanded control- and seHAdV-specific T-cells.
CFSE-labeled autologous or allogeneic responder cells (PBMCs or seHAdV-T-cells) were mixed 1∶1 with irradiated stimulator cells (PBMCs) and incubated for 7 to 8 days. A) The graph shows the total number of proliferated viable cells per 96 well plate of 14 different donor/recipient combinations A–N). Proliferation of seHAdV-T-cells or PBMCs in response to autologous (auto) or allogeneic (allo) irradiated PBMCs are shown. In addition, representative examples from donors A and J are given. B) A summarizing graph show mean + SEM from all combinations (except for L,M and N); The percentage of viable proliferating seHAdV-T-cells was set to 100% and calculated based on total cell number. C) seHAdV-T-cells or seMAGE-1A-T-cells (control) and PBMC were mixed with allogeneic irradiated stimulator PBMCs. A summarizing graph shows mean + SEM of 4 combinations. First, total cell number of viable proliferating (CFSE-low) seHAdV-, seMAGE-1A-T-cells and PBMCs/well are calculated. Based on these total cell number, the percentage values were analyzed and compared to allogeneic PBMCs, which was set to 100%. A representative histogram of one donor is shown, including percentage values of proliferated cells. Significance vs HAdV-T-cell line: o, p< = 0.07; *, p< = 0.01.***, p< = 0.001.

