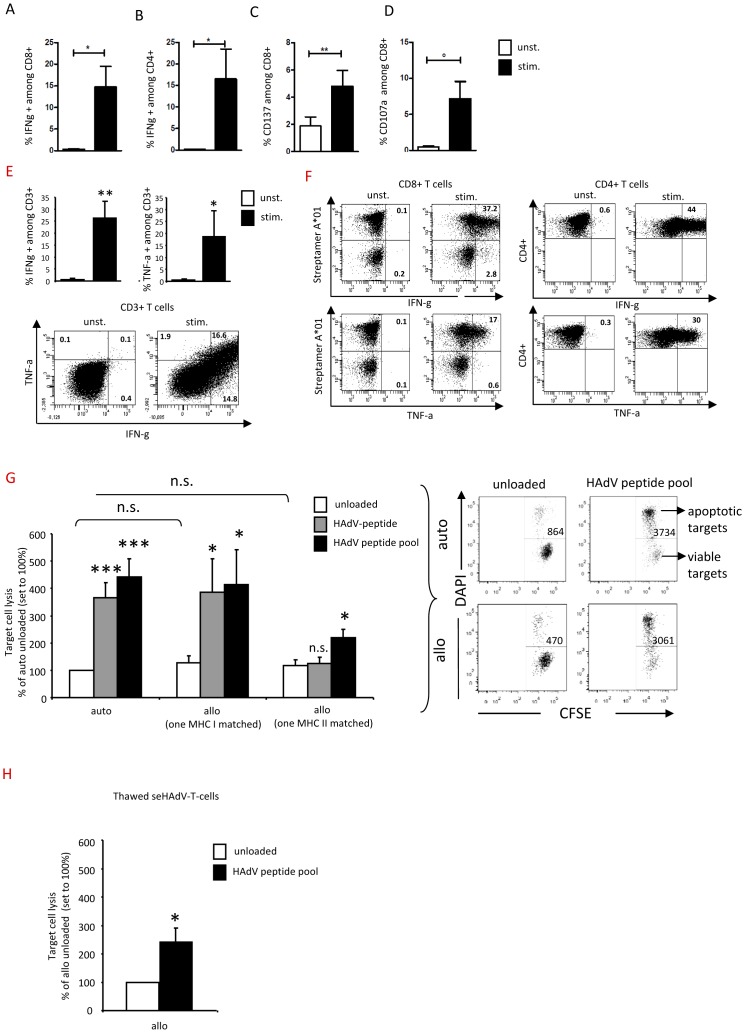
Figure 6. Functional and cytolytic activity of seHAdV-T-cells.
seHAdV-T-cells were used for the cytotoxic assay. The percentage values of IFN-γ, CD137 and CD107a expressing seHAdV-T-cells among CD4+ and/or CD8+ are shown A–D) as indicated. E) The percentage values of IFN-γ and TNF-α among CD3+ cells are shown, including representative dot plots indicating simultaneous expression. F) Representative dot plots of IFN-γ and TNF-α-expressing CD8+ T-cells including streptamer+ T cells and CD4+ T-cells. G) Specific lysis is shown of autologous and allogeneic PHA-blasts (target cells) matched in only a single MHC I, or in only a single MHC II, unloaded (white bar), HAdV-peptide- (grey bar) or HAdV-peptide pool (black bar)-loaded, induced by seHAdV-T-cells. The total number of “dying” target cells/well was evaluated from each sample. Based on these, a summarizing graph shows the percentage of dying target cells related to unloaded autologous (auto) target cells which is set to 100%. Representative dot plots, indicating “dying” cells/well, are shown. H) Specific lysis of allogeneic, unloaded (white bar) or HAdV-peptide pool (black bar)-loaded target cells induced by post-thaw seHAdV-T-cells. Based on total cell number of dying cells, a summarizing graph shows the percentage of dying target cells related to unloaded target cells, which is set to 100%. Significance vs unloaded autologous targets: ns = not significant, *, p< = 0.01.***, p< = 0.001.

