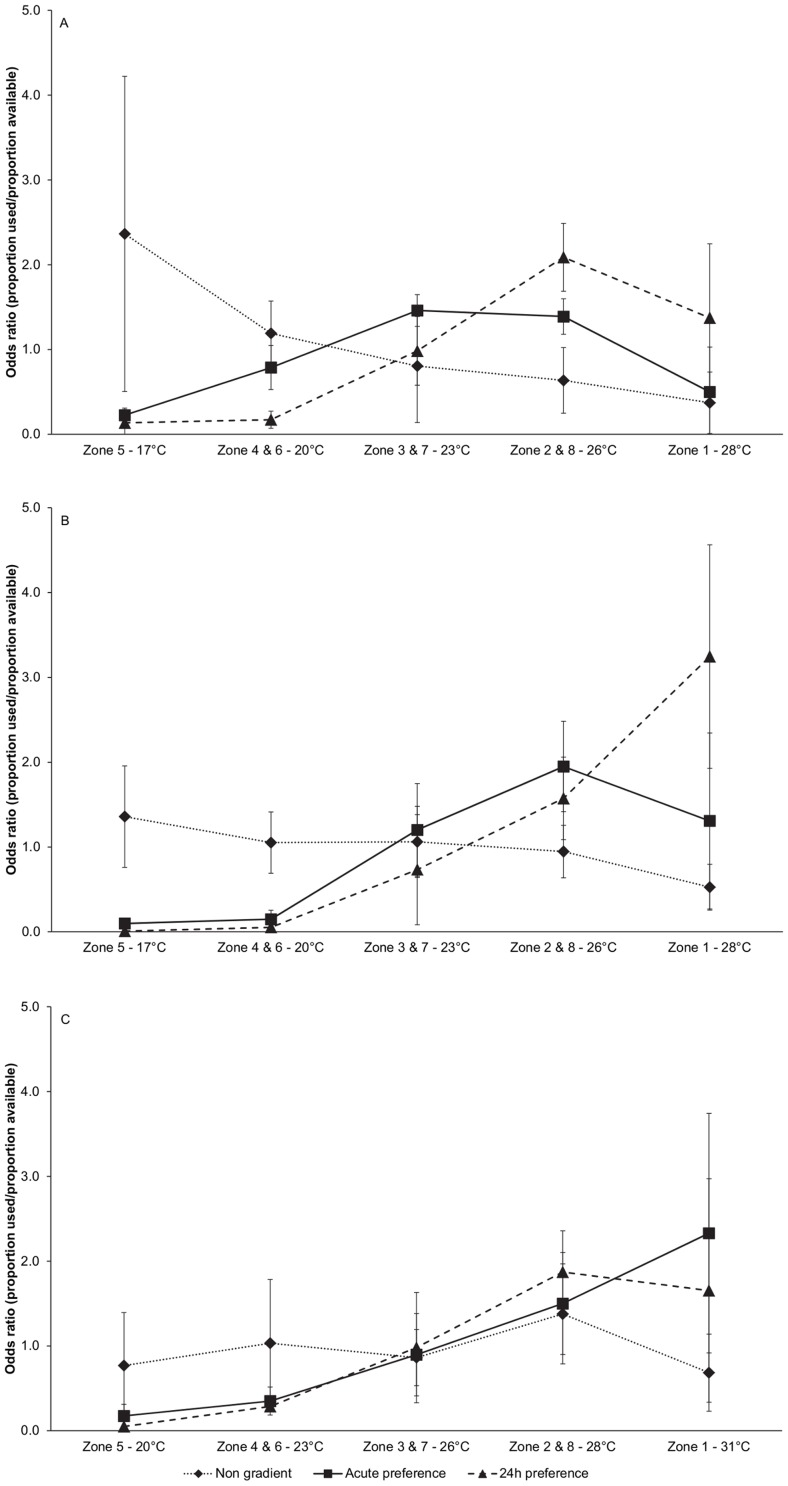
Figure 4. Fish distribution over the preference chamber.
Fish distributions during non-gradient, acute preference and 24 h preference observations are expressed as odds ratios (proportion of temperature zones used dived by the proportion of temperature zones available) and are presented for fish acclimated to 18°C (A), 22°C (B) and 28°C (C). Fish distribution was non-random during all non-gradient observations (MANOVA, p = 0.002) without differences among temperature acclimation treatments (MANOVA, p = 0.42). Fish distribution observed during acute preference observations differed significantly from the non-gradient observations (MANOVA, p<0.001). Fish distribution during 24 h preference observations differed significantly from the non-gradient (MANOVA, p<0.0001) as well as the acute preference observations (MANOVA, p<0.002). Among acclimation temperature treatments fish distribution differed during acute preference observations (MANOVA, p = 0.01) but not during the 24 h preference observations (MANOVA, p = 0.21).

