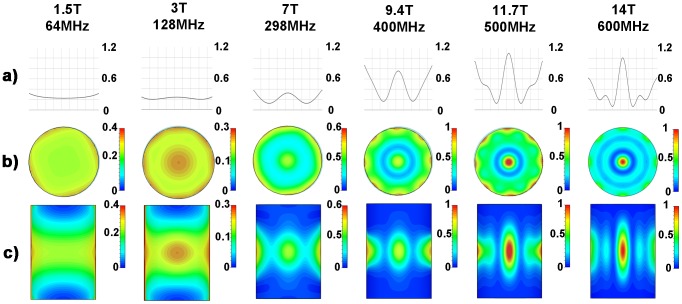
Figure 4. Synopsis of SAR simulations for frequencies ranging from 64 MHz (1.5 T) to 600 MHz (14.0 T).
Point SAR [W/kg] distributions derived from numerical EMF simulations of an 8 channel bow tie antenna applicator using discrete MR frequencies ranging from 64 MHz (1.5 T) to 600 MHz (14.0 T). Point SAR profile along a middle line through the central axial slice of the cylindrical phantom (a). Point SAR distribution of the central axial slice of the cylindrical phantom (b). Point SAR distribution of the mid-coronal slice through the cylindrical phantom (c). A decrease in the size of the SAR hotspot was found for the axial and coronal view when moving to higher field strengths.

