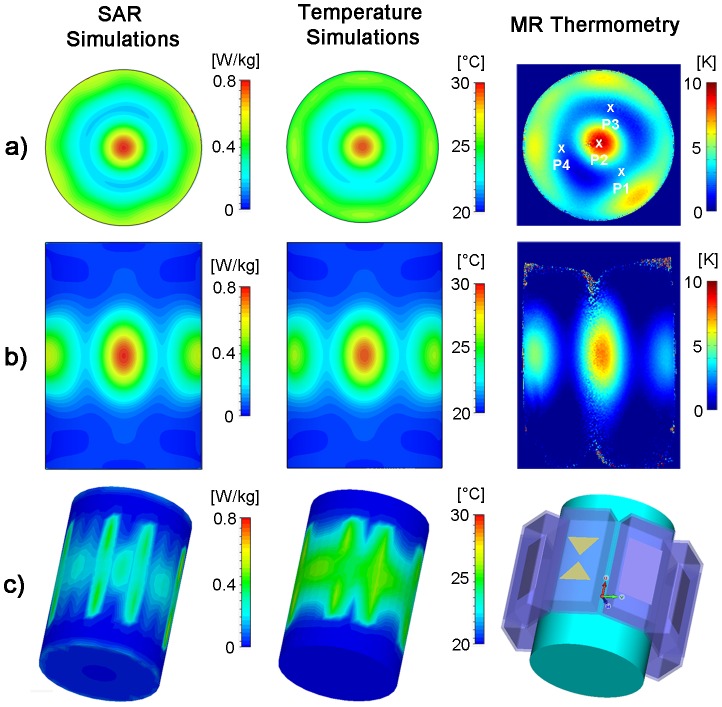
Figure 8. Targeted RF heating in a phantom: simulation and experiment.
Axial and coronal views of specific absorption rate (left) and temperature (middle) distribution derived from EMF and temperature simulations using an 8 channel applicator together with a cylindrical phantom and a 1H excitation frequency of 298 MHz. For comparison, a temperature map derived from MR thermometry of the same slice at 7T (298 MHz) using the TX/RX applicator is shown (right). For the experimental setup a heating period of 3 min was used. SAR and temperature hotspots were induced in the center of the phantom by using no phase shift between the bow tie antennas. P1–P4 indicate the location of the fiber optic temperature probes.

