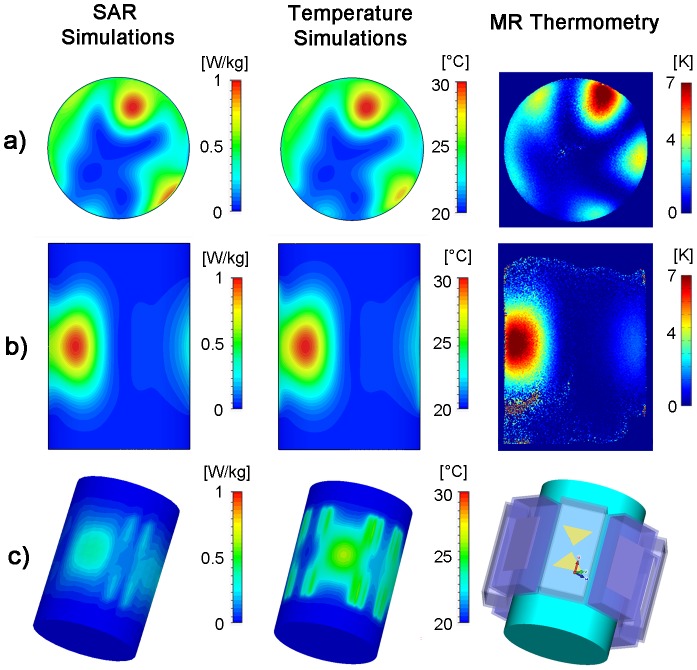
Figure 9. 2D steering of targeted RF heating in a phantom: simulation and experiment.
Axial and coronal views of specific absorption rate (left) and temperature (middle) distribution derived from EMF and temperature simulations using the 8 channel applicator, a cylindrical phantom and a 1H excitation frequency of 298 MHz. For comparison, a temperature map derived from MRTh acquisitions at 7T (298 MHz) using the TX/RX applicator is shown (right). For the experimental setup a heating period of 120 s was used. A set of phase shifts (Ch1:0°, Ch2:45°, Ch3:180°, Ch4:225°, Ch5:0°, Ch6:225°, Ch7:135°, Ch8:45°) between the bow tie antennas was used to steer the SAR and temperature hotspot towards the surface of the phantom.

