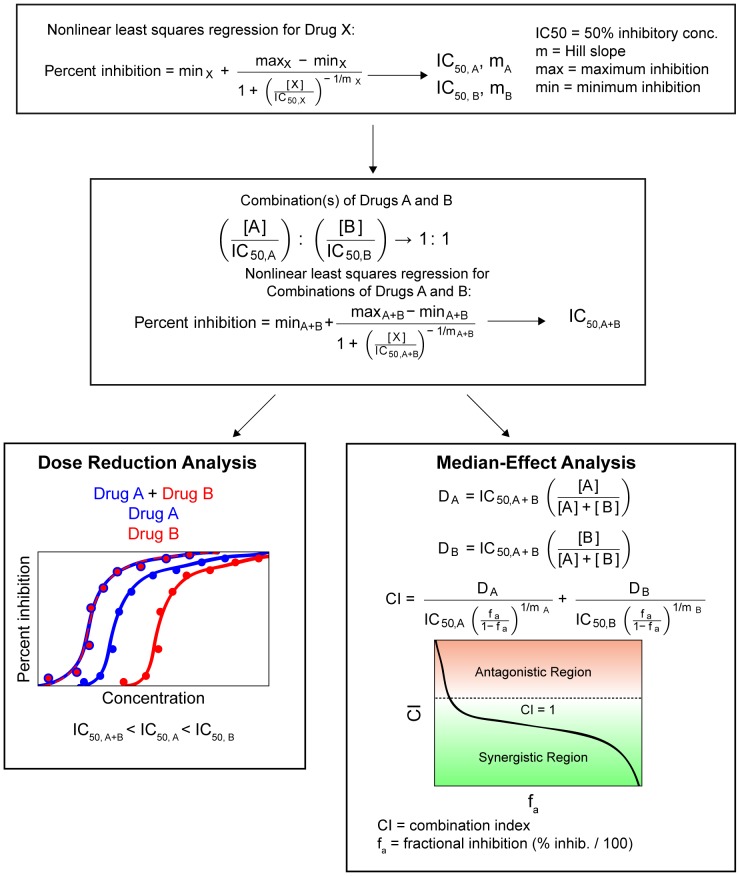
Figure 1. Schematic diagram for combination effect analysis.
Drug combinations were analyzed for their ability to affect dose reduction and synergy. First, individual drugs, either free or encapsulated, were used to create dose response curves using the TZM-bl assay. These curves were fit to a sigmoid curve using nonlinear least squares regression to estimate drug IC50 and the Hill slope. Next, combinations of drugs at their equipotency ratio (1∶1 ratios of IC50 values) were used to create similar curves using the TZM-bl assay. These were also fit to a sigmoid curve using nonlinear least squares regression to estimate the IC50 and Hill slope of the combination. Finally, comparison of IC50 values combinations were used to estimate dose reduction. The median-effect analysis was performed to measure combination effects.

