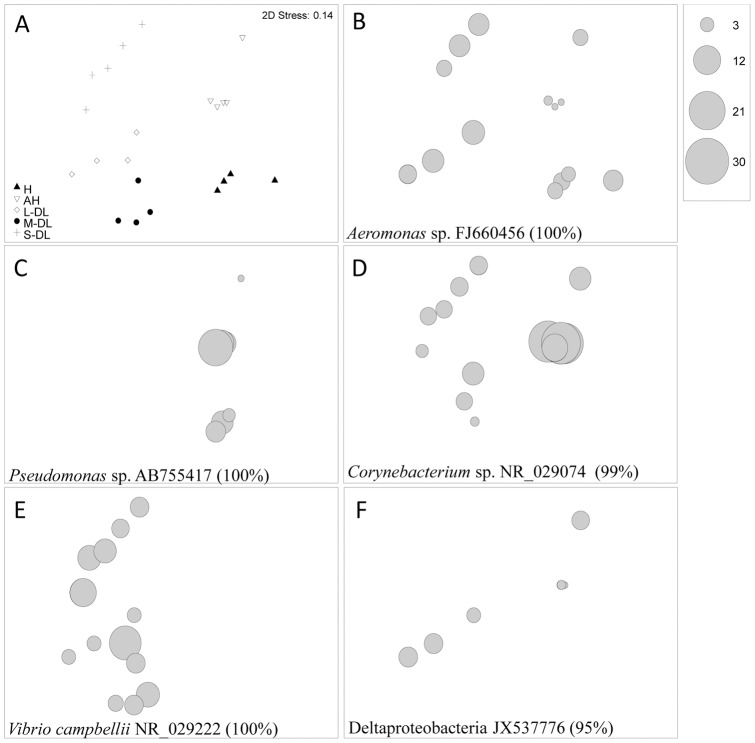
Figure 3. Non Metric Multidimensional scaling (MDS) plots.
(a) shows changes in 16S rRNA gene bacterial communities between healthy (H), apparently healthy (AH) and three different sized disease lesions; Small Disease Lesion (S-DL), Medium Disease Lesion (M-DL) and Large Disease lesions (L-DL) from corals showing signs of Dark Spot Syndrome. (b-f) MDS bubble plots of a subset of bacterial ribotypes derived from SIMPER analysis which gives the ribotypes offering the greatest differences or similarities between sample types.

