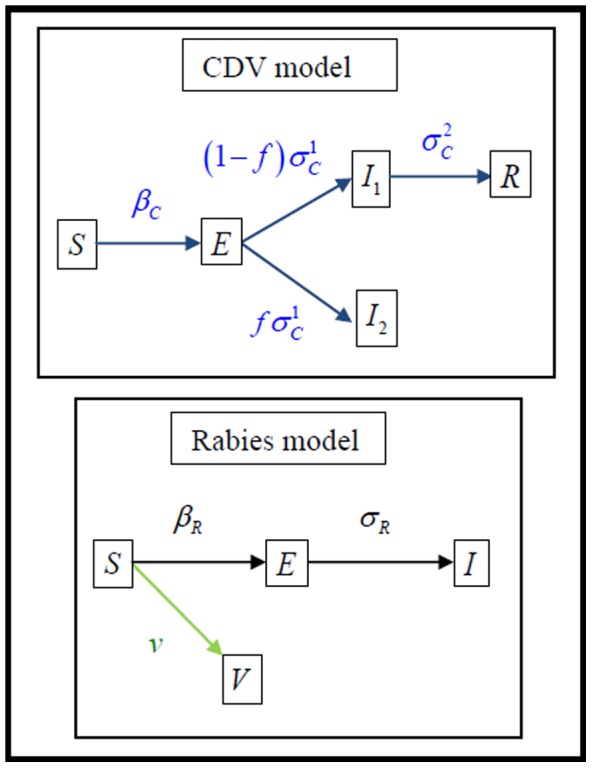
Figure 3. Flow chart between different compartments for the CDV and rabies models.

By convention, each compartment is characterised by the density of susceptible  , exposed
  , infectious
  (
( for CDV see methods) and recovered
  from CDV or vaccinated
  against rabies. In the flow chart, demography and virulence induced mortality are omitted leaving only the links between compartments due disease acquisition and development. The corresponding system of differential equations is presented in the materials and methods section.
