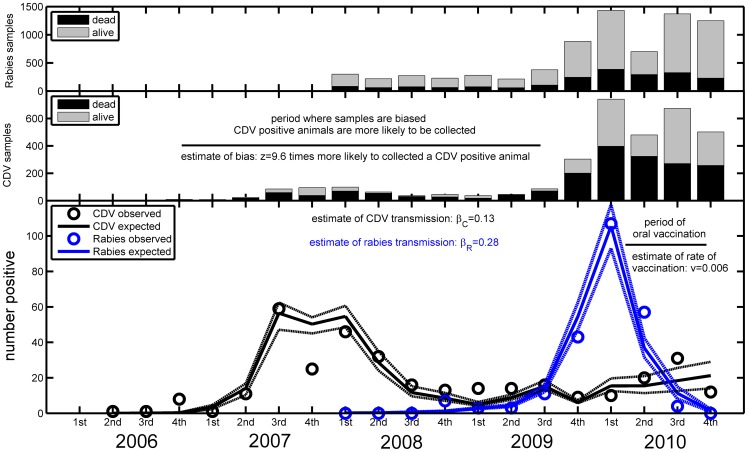
Figure 4. Observed (circle) and expected (solid line) positive cases of CDV (black) and rabies (blue) in the fox population from 2006 to 2010.
The fit was obtained by maximum likelihood and corresponds to  and
and  equal to 0.13 and 0.28 respectively. Both diseases were estimated to have started during the same quarter as they were first observed. The rate of vaccination was estimated at v = 0.006 and CDV samples prior to the last quarter of 2009 were estimated to be biased toward reporting z = 9.6 times more CDV positive foxes than CDV negative foxes. Based on each set of parameters' estimates from the bootstrap procedure we obtain each expected trajectory and thus obtain the 95% confidence interval around our model fit for each quarter, broken lines (this ignores temporal correlations within each trajectory). In the upper panels, for each disease, we present the sampling sizes for each quarter as well as the proportion of samples taken on either dead or living animals.

