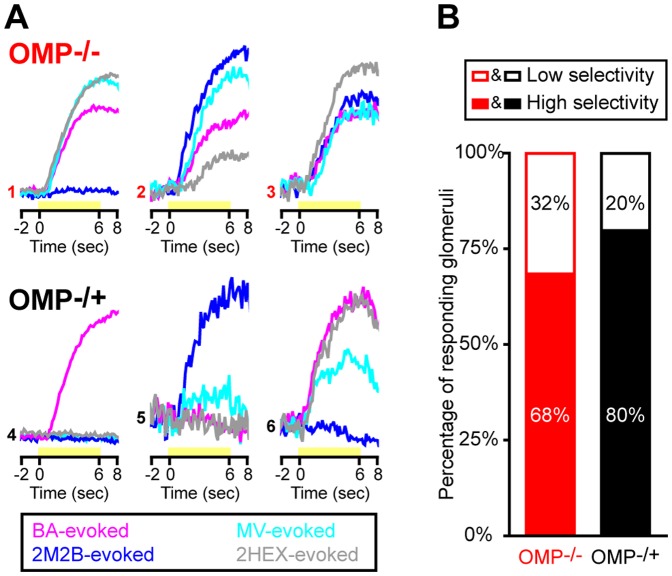
Figure 2. Odorant response selectivity is reduced in glomeruli from OMP−/− mice.
(A) Example odorant response selectivity patterns in 6 individual glomeruli; 3 OMP−/− glomeruli (top row, traces 1–3) and 3 OMP−/+ glomeruli (bottom row, traces 4–6). Each set of 4 traces corresponds to a single glomerulus' responsivity to 4 test odorants that were all presented at a concentration of 30 a.u.: butyl acetate (BA, magenta), methyl valerate (MV, cyan), trans-2-methyl-2-butenal (2M2B, blue), and 2-hexanone (2HEX, grey). Each set of traces is scaled relative to the maximum evoked response across all 4 odorants per glomerulus. Yellow bars indicate the time when odor stimuli were presented. (B) Percentage of OMP−/− (red) and OMP−/+ (black) glomerular populations that were categorized as having higher (closed bars) or lower (open bars) odorant response selectivity.

