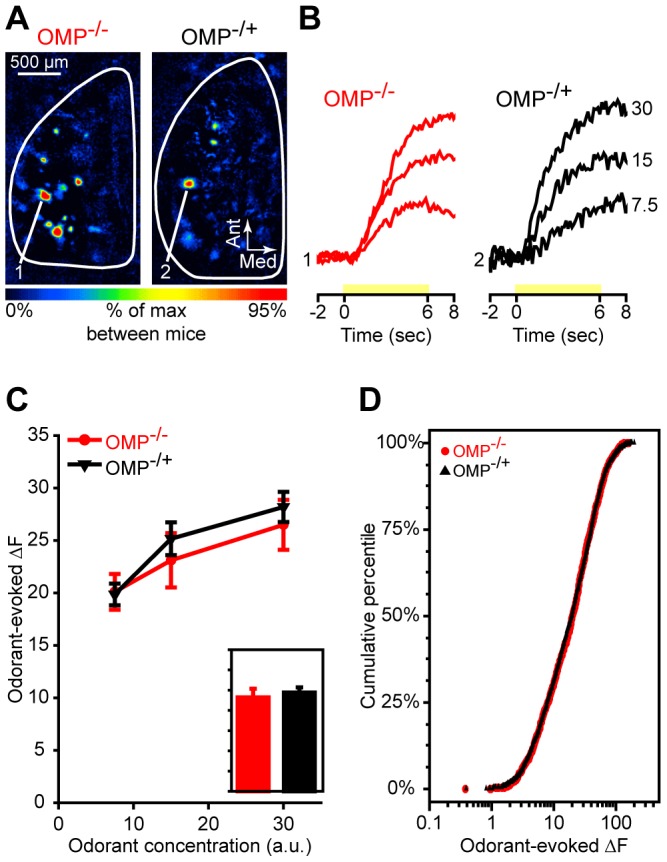
Figure 3. The magnitude of peak spH responses is unaltered in OMP−/− mice.

(A) Pseudocolored difference maps from an OMP−/− mouse (left) and an OMP−/+ mouse (right). These maps were evoked by presentation of 2HEX at a concentration of 30 a.u. (B) Sets of traces from an OMP−/− mouse (left) and an OMP−/+ mouse (right) corresponding to the numbered callouts in A. Traces were evoked by 3 concentrations of 2HEX (labeled on the right in a.u.) and are all scaled relative to the maximum response across concentrations and between the two glomeruli. Yellow bars indicate time of 2HEX presentation. (C) Mean (±SEM) odorant-evoked change in fluorescence (ΔF) plotted as a function of odorant concentration. The overall group means shown in the inset, which is scaled to the y-axis of C, are averaged across all odors and concentrations. (D) Cumulative probability plot showing the distributions of odorant-evoked ΔF values for populations of glomerular responses in OMP−/− mice and OMP−/+ mice. ΔF distributions for each group are pooled across 3 concentrations of 4 test odorants. In B, C, and D OMP−/− mice and OMP−/+ mice are shown in red and black, respectively.
