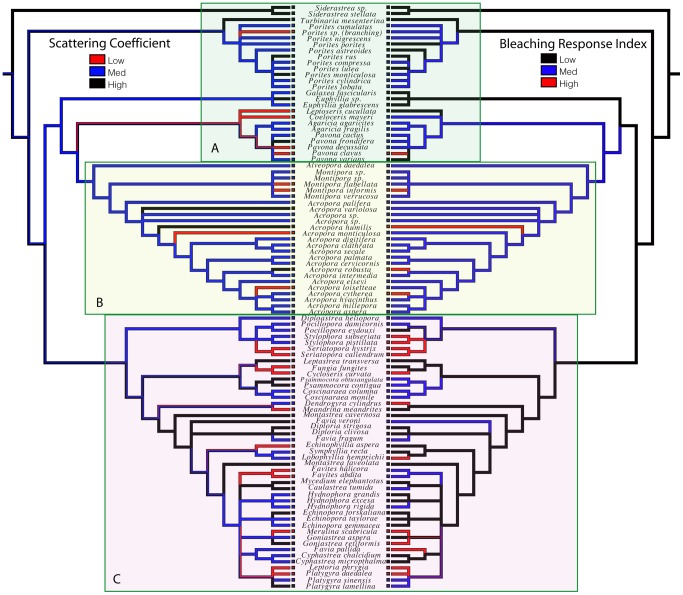
Figure 4. Evolutionary correlation between scattering coefficient and coral bleaching.
A composite phylogeny shown in mirror image, with character states for  (left) and BRI (right) mapped to illustrate their significant correlation (p<0.05) throughout the evolutionary history of corals. High bleaching susceptibility appears to be less common toward the base of the coral tree (box A) and higher in the Montipora-Acropora clade (box B) and the “Robusta” coral clade (box C).

