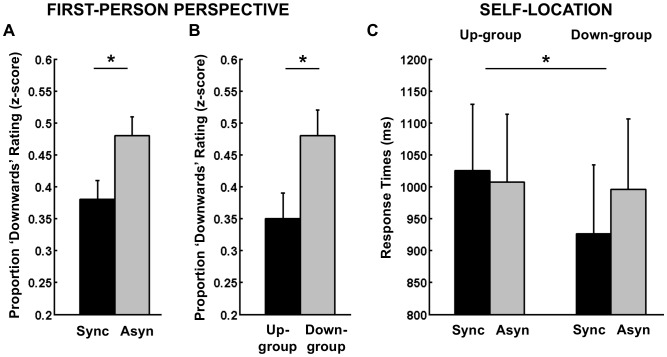
Figure 3. Results of Experiment 2.
Frequency of “downwards” ratings for the experienced direction of the first-person perspective showing the main effect of Stroking (A) and Group (B). (C) Self-location results showing average response times in the Mental Ball Dropping task. Error bars indicate standard error of the mean.

