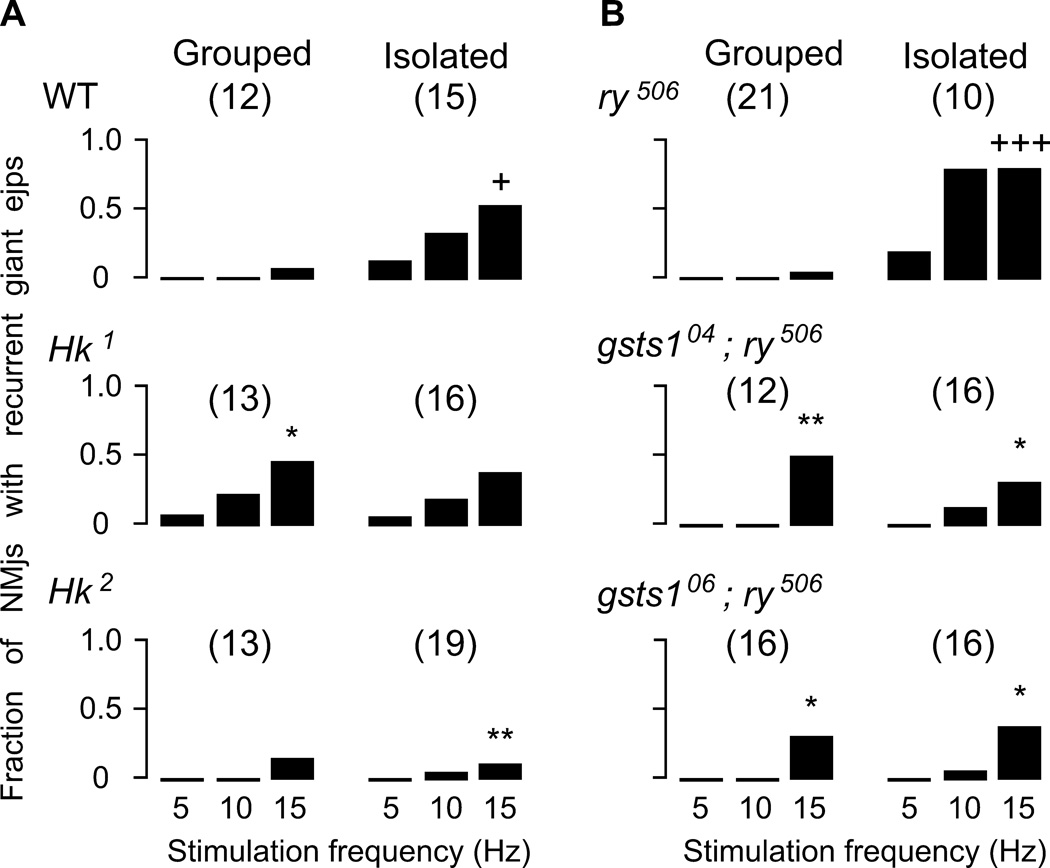
Figure 5.
Stimulus-frequency dependent profile of persistent giant ejp induction. The fraction of NMJs displaying recurrent giant ejps during a 10-s stimulation period is plotted against the nerve stimulation frequency (see Methods). Note that WT and ry control line displayed clear effects of isolation rearing to increase the propensity of giant ejp induction (+, p < 0.05 and +++, p < 0.001. X2-test for 15-Hz nerve stimulation). Group-reared Hk1 and gsts1 mutant alleles displayed higher neuromuscular transmission than group-reared WT and ry control (*, p < 0.05 and **, p < 0.01). However, isolation rearing did not further enhance the excitability level in these mutants. Note that isolation-reared WT and ry displayed more frequent recurrent giant ejps than Hk2 and gsts1 alleles. Total numbers of NMJs tested for each genotype are shown in parenthesis.

