Figure 7.
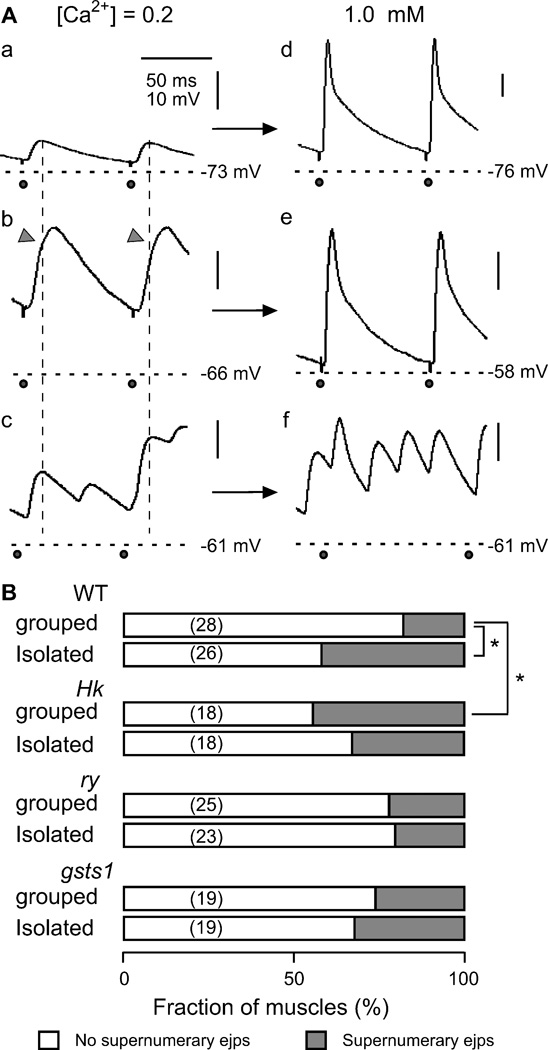
Supernumerary ejps at physiological concentrations of Ca2+. A. Different types of ejps triggered by high-frequency nerve stimulation (10 and 15 Hz) in saline containing low (0.2 mM, left column) or physiological (1.0 mM, right column) concentrations of Ca2+ in WT larvae. NMJs displaying normal ejps (a, group-reared larvae) or giant ejps with a notch in the rising phase (arrow head in b, isolation-reared larvae) in low-Ca2+ saline produced large ejps with a normal waveform when Ca2+ was increased to 1.0 mM (d, e). NMJs displaying multi-peak ejps in low-Ca2+ saline (c, isolation-reared larvae) retained supernumerary discharges when Ca2+ was raised to a physiological concentration (f). Horizontal dashed lines indicate resting membrane potential and vertical dotted lines mark the peaking time of normal ejps.  , nerve stimulation. B. Fraction of NMJs displaying supernumerary ejps at 1 mM Ca2+ associated with different genotypes and rearing conditions. *, p < 0.05 (X2-test). Number of NMJs in parentheses.

