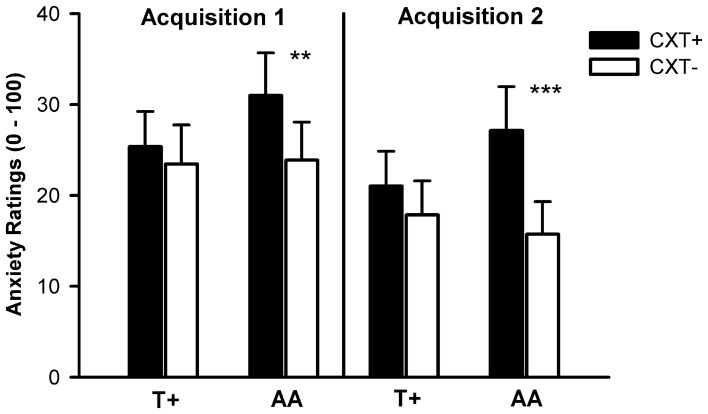
Figure 5.
Anxiety ratings from 0 (no anxiety at all) to 100 (very high anxiety) after Acquisition 1 (left) and Acquisition 2 (right) on Day 1. Black bars depict ratings for CXT+ (anxiety context). White bars depict ratings for CXT− (safety context). Results are shown separately for NPSR1 genotype groups (T+ vs. AA carriers). Error bars represent standard errors of the mean (SEM). **p < 0.01, ***p < 0.001.

