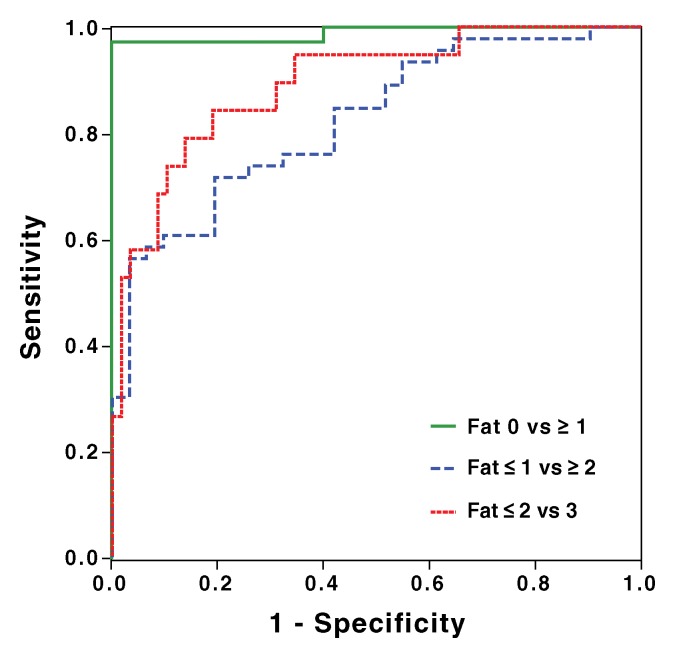
Figure 4:
Receiver operating characteristic curve analysis of MR imaging–PDFF for classification of dichotomized steatosis grades determined by histologic validation: 0 versus ≥1 (area under the curve = 0.989), ≤1 versus ≥2 (area under the curve = 0.825), and ≤2 versus 3 (area under the curve = 0.893).

