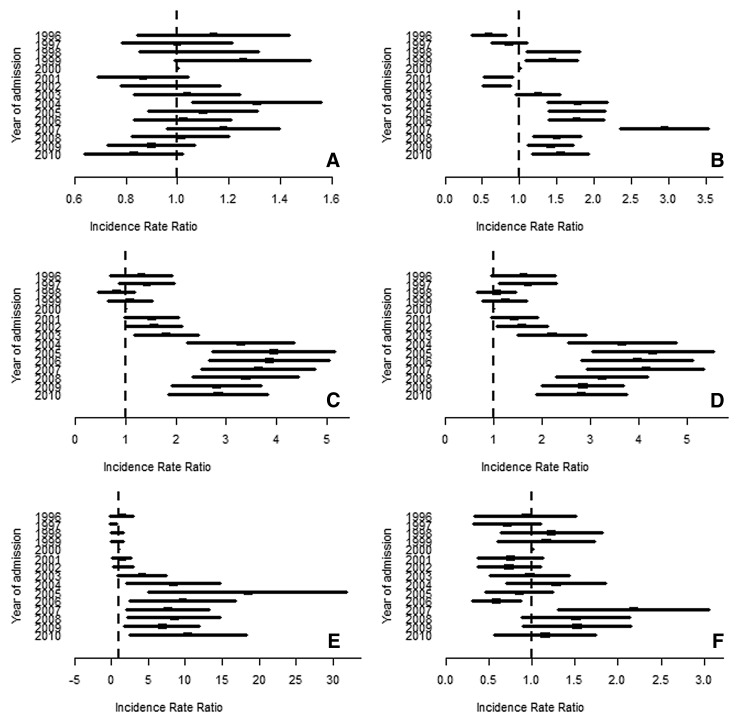
Figure 2:
Point graphs show the results of negative binomial analyses conducted to evaluate the trend in CT use over the study period (2000 is the baseline for comparison) for CT examinations performed in each body region in children 0–14 years old. Analyses were adjusted for patient sex, race and/or ethnicity, insurance status, mechanism of injury, injury severity score, final disposition (dead vs alive), and year of admission. Body regions imaged included A, head; B, spine; C, abdomen; D, pelvis; E, thorax; and F, maxillofacial region.

