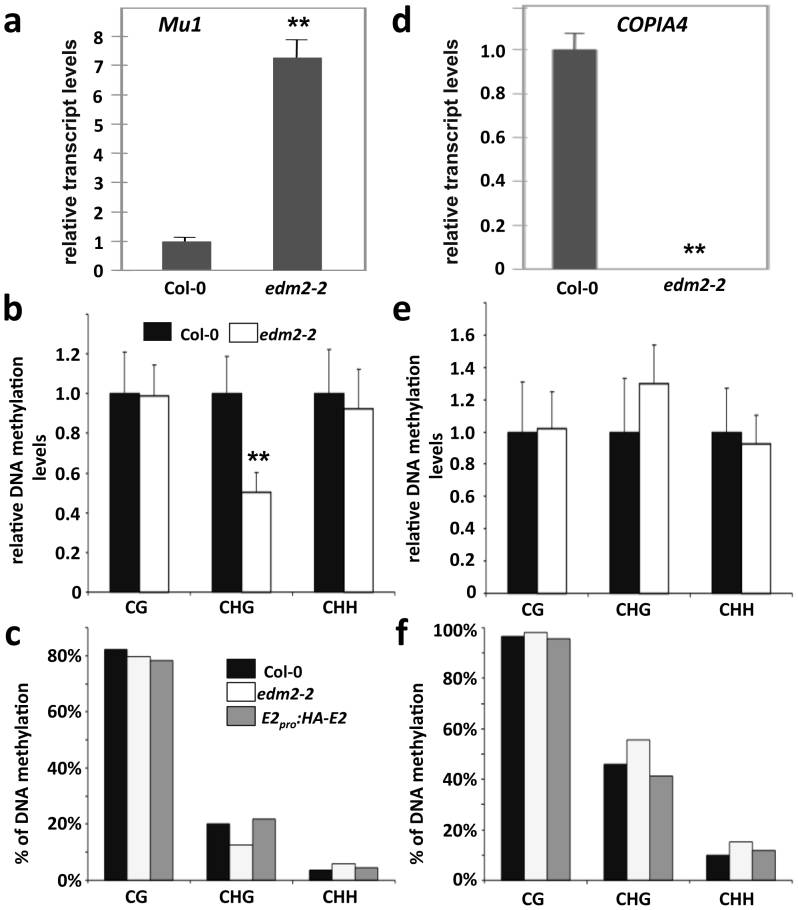
Figure 2. EDM2 affects transcript and CHG methylation levels at Mu1 and COPIA4.
(a) & (d): Mu1 and COPIA4 transcript levels determined by qRT-PCR. (b) & (e): Extent of DNA cytosine methylation at CG, CHG or GHH sites in the bodies of Mu1 (b) and COPIA4 (e) determined by chop-qPCR. Each PCR-amplified genomic region contains 1 recognition site of methylation sensitive restriction enzyme HpyCH4IV (for CG site), BglII (for CHG site), AflII (CHH site in Mu1) or HaeIII (CHH site in COPIA4). Data represent mean plus SD of three biological replicates. Statistical significance was determined using Student's t-test (** P < 0.01 compared with Col-0) as described previously58. (c) & (f): The percentage of methylated cytosine at Mu1 (c) and COPIA4 (f) determined by bisulfite sequencing.

