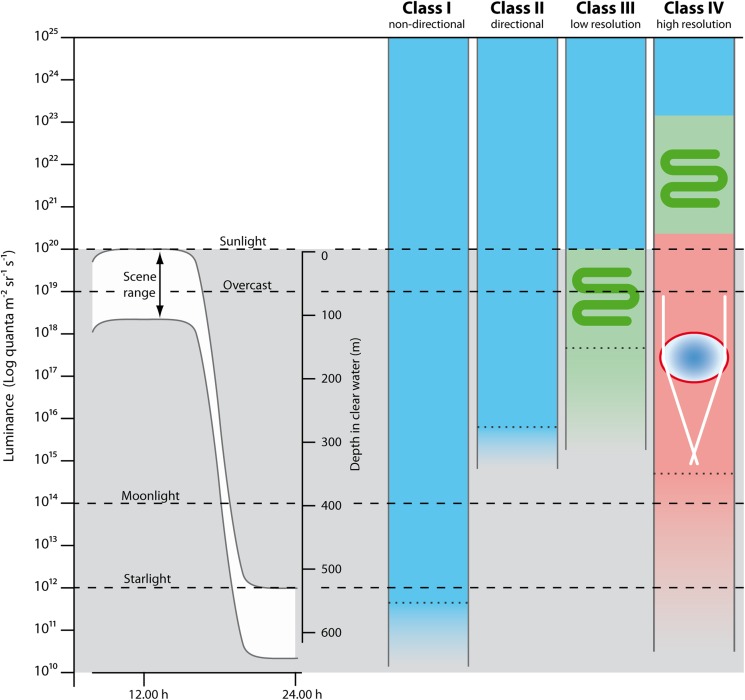
Fig. 2.
Minimum intensities from Table 1, for the four classes of sensory tasks, plotted together with the daily variation of natural luminances and daylight intensities at different depths in clear water. Blue indicates calculations for a 10 µm diameter cell with no membrane stacking and no focusing optics (just screening to obtain the desired detection angle). Calculations for membrane stacking are indicated by green and for focusing optics (and membrane stacking) by red. The color gradients at the lower end of the bars show the range of gradually decreasing function between the primary values from Table 1 (dotted lines), and the bracketed values where sensory information is assumed too poor for the task.

