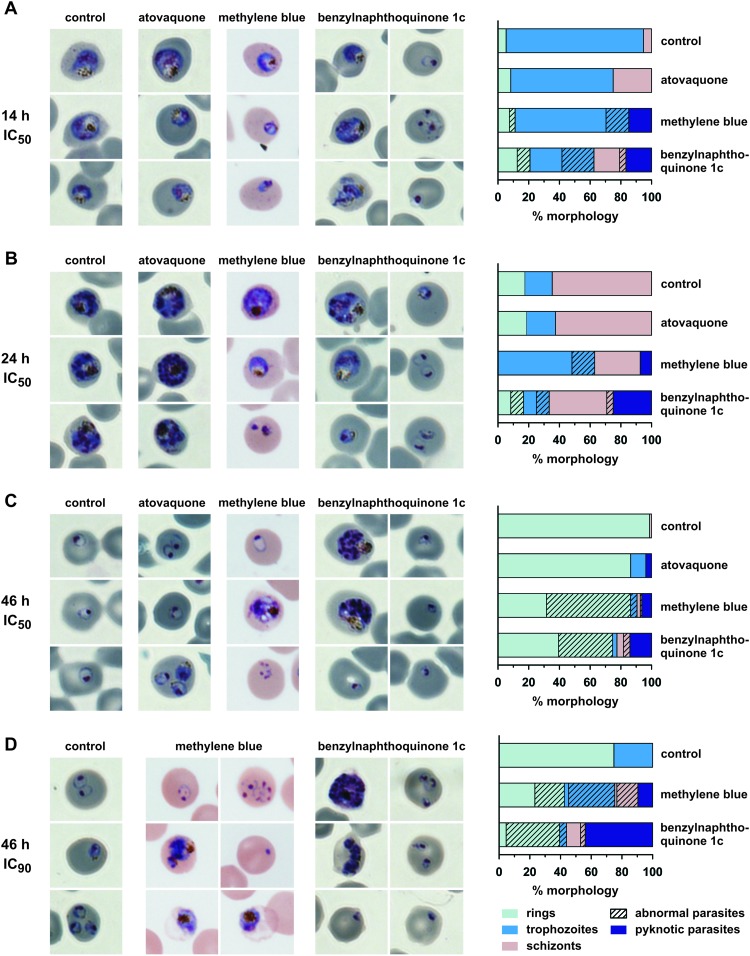
Fig 3.
Parasite morphology after treatment with atovaquone, methylene blue, or benzylnaphthoquinone 1c. Synchronized parasite cultures were treated with one of the drugs at the ring stage (approximately 16 h postinfection). An untreated control culture was analyzed in parallel. (A to C) Treatment with the IC50 concentrations for 14 h (A), 24 h (B), and 46 h (C). (D) Treatment with the IC90 concentration for 46 h. Quantifications of the observed morphologies of the remaining parasites at each time point are shown on the right side. Color differences between the microscopic images are due to white balance settings and were not adjusted in order to avoid image manipulation.

