
Fig 5.
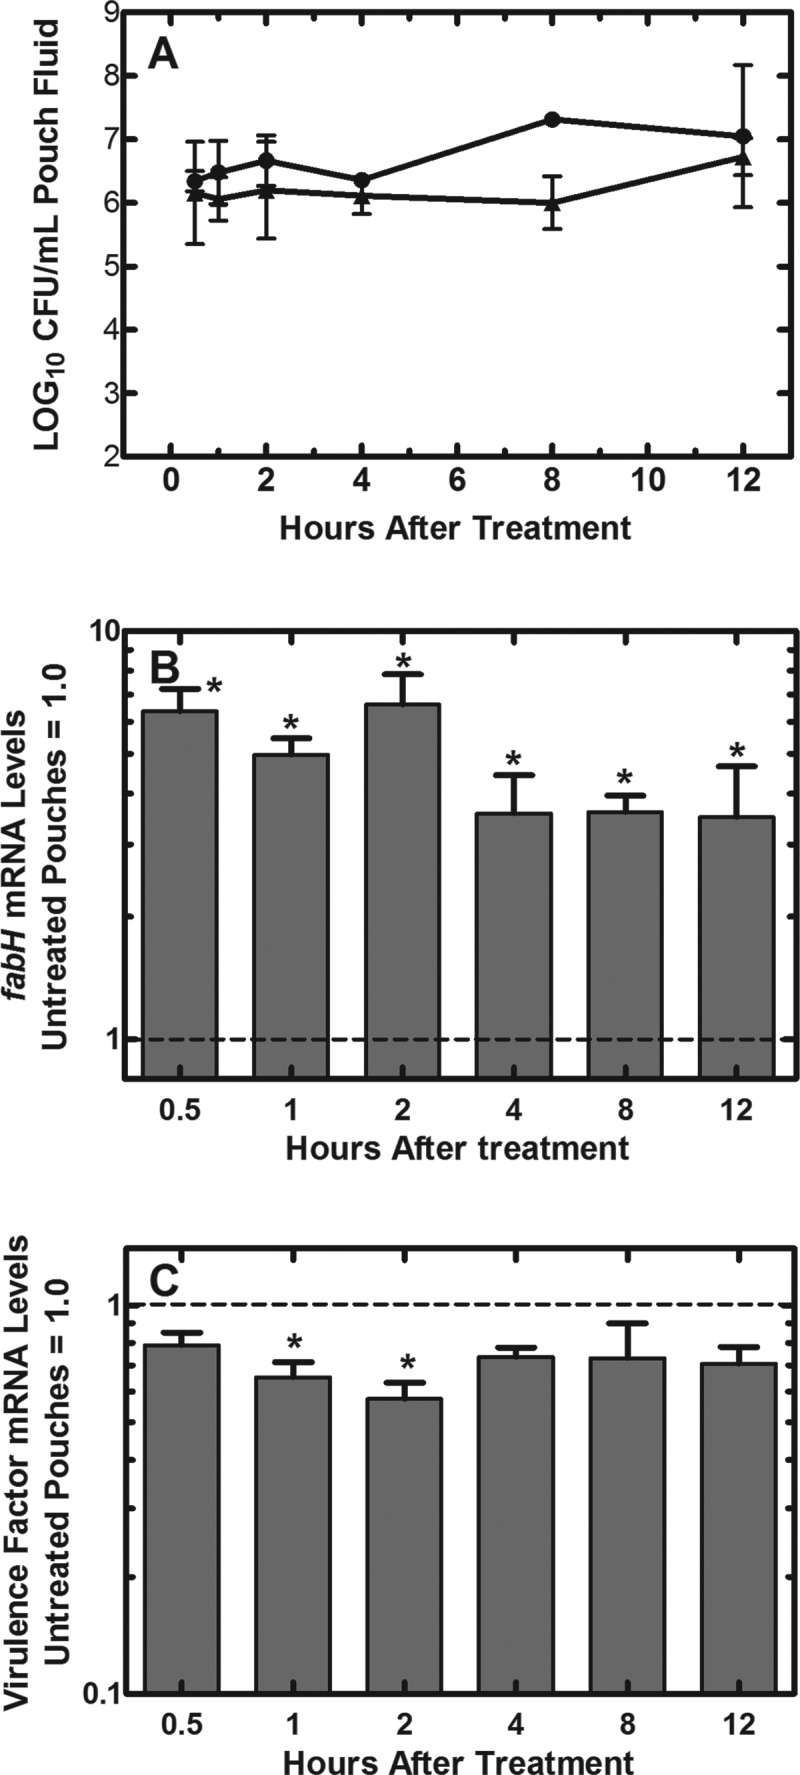
Virulence factor and fabH expression levels following treatment of infected pouches with AFN-1252. (A) Bacterial load in the pouches of AFN-1252-treated (▲) and untreated (●) pouches. (B) The levels of fabH mRNA in AFN-1252-treated samples relative to fabH expression levels in untreated samples. At all time points, fabH transcript levels were significantly elevated over controls (P < 0.05). (C) The average levels of 4 virulence factor mRNAs expressed in the AFN-1252-treated pouches relative to the expression levels in untreated controls. qRT-PCR was performed using gmk as the internal standard. The significance of differences between samples was determined by the Student t test. The modest reduction in virulence gene expression levels was significant only at 1 and 2 h (*, P < 0.05). Error bars indicate standard deviations. The exception is the 8-h untreated-pouch time point in panel A, which consisted of only a single determination.