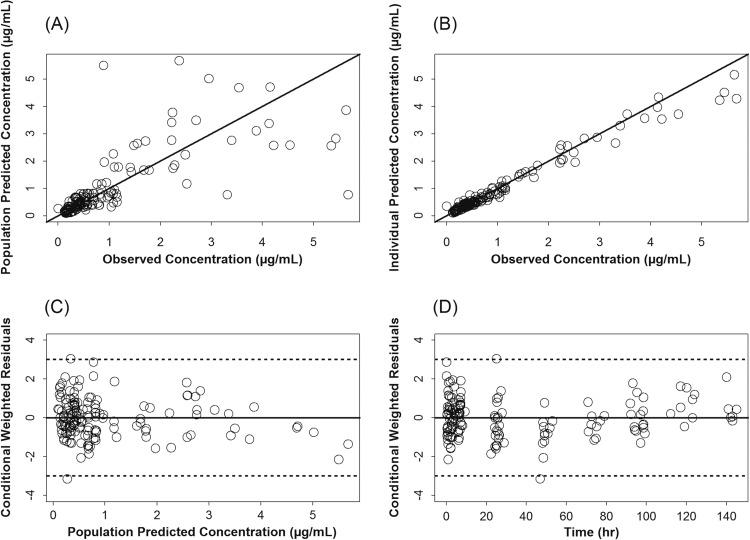
Fig 1.
Diagnostic scatter plots for the population PK model, including data from the 10- and 20-mg/kg single doses of azithromycin (AZI) given i.v. (A) Population-predicted versus observed AZI plasma concentrations; (B) individual-predicted versus observed AZI plasma concentrations; (C) conditional weighted residuals versus population-predicted plasma AZI concentrations; (D) conditional weighted residuals versus time. (The solid black lines represent the lines of identity in panels A and B and zero residuals in panels C and D. Dashed lines represent ±3 standard deviations.)

