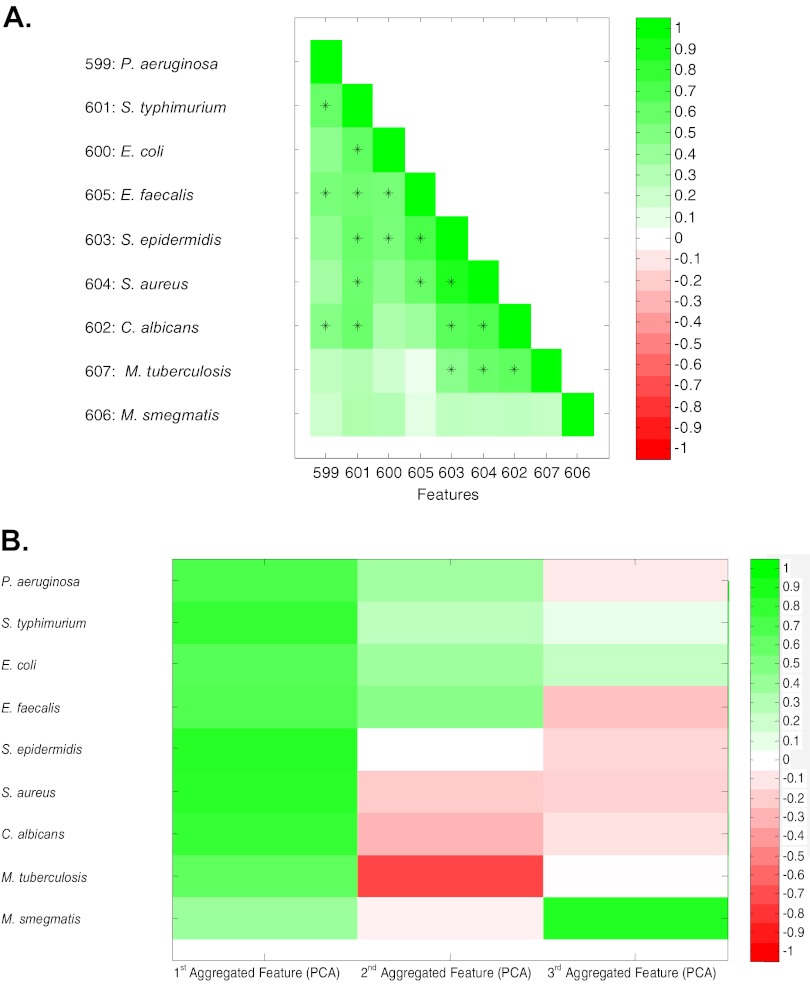
Fig 2.
Correlations of CAMP activities between diverse microbes. Peptides in PL-D were assayed for their MICs against 9 microbes, and their patterns of activities were compared using correlation analyses and principle component analyses. (A) Correlation analyses were used to compare peptide activities (logarithmic MIC) against pairs of microbes using a range of correlations (Pearson coefficients). Green indicates positive correlation; white, no correlation; red, negative correlation (not found). All statistically significant positive correlation coefficients between different species with P values of <0.05 (after Bonferroni correction of 36 pairs with P values of <0.0014) are indicated by +. (B) Principle component analysis (PCA) was used for multiple comparisons to identify shared (aggregated) features. The first three factor loadings correlated with the logarithmic MIC of peptides in PL-D. The first feature contains 49.7%, the first two features contain 66.5%, and the first three features contain 76.2% of the information. The first three aggregated features were used to do PCA on peptides in PL-D using Pearson correlation coefficients. Correlations are indicated by colors: green, positive; red, negative; white, no correlation.

