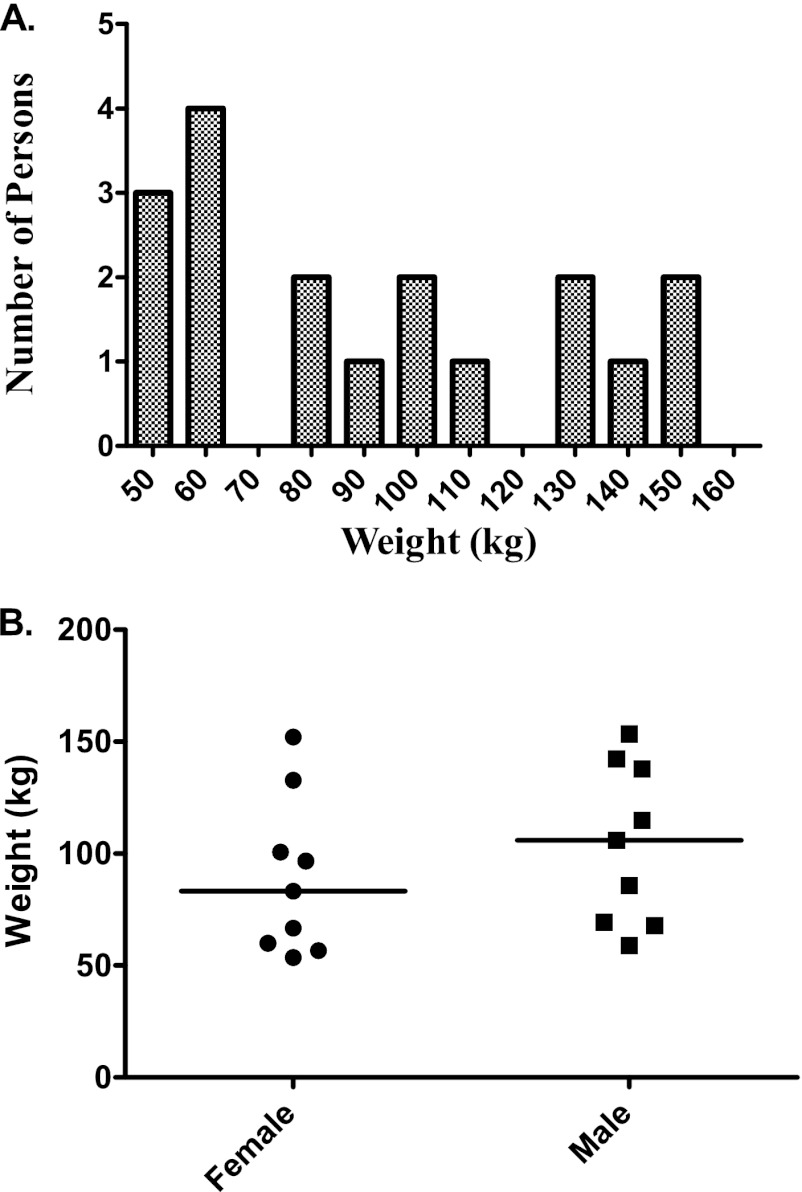
Fig 1.
Weight distribution in people recruited into the caspofungin study. (A) The recruitment was meant to capture all extremes of weight; thus, the weight is not normally distributed. (B) Distribution of weight by gender. Weight did not differ significantly by gender based on a Mann-Whitney U-test comparison.

