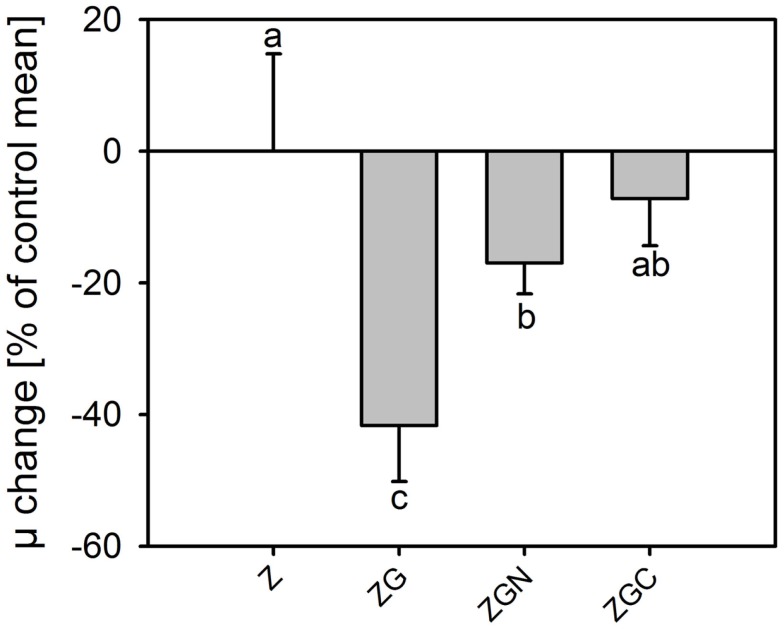
Figure 6.
Change in relative growth rates of Chlorella mirabilis under different nutrient treatments in the out-door micro-scale mass cultivation experiment. The values were normalized to the control mean (100%). The zero line corresponds to 100% of the control. See Table 1 for treatment abbreviations (mean ± SD, n = 6). The same letter indicates homologous groups as recognized by the Tukey HSD test at p = 0.05; the Z medium (control) is included in the group labeled “a.”

