Figure 3.

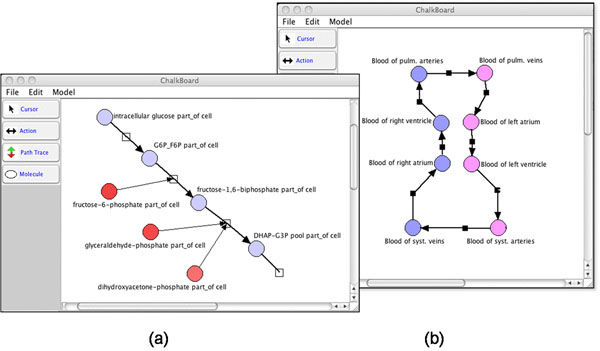
Prototype PhysioMaps as visualized by the Chalkboard system (Cook et al., 2007): (a) shows a simple model of glycolysis and (b) shows blood flow processes in a cardiovascular (CV) model.

Prototype PhysioMaps as visualized by the Chalkboard system (Cook et al., 2007): (a) shows a simple model of glycolysis and (b) shows blood flow processes in a cardiovascular (CV) model.