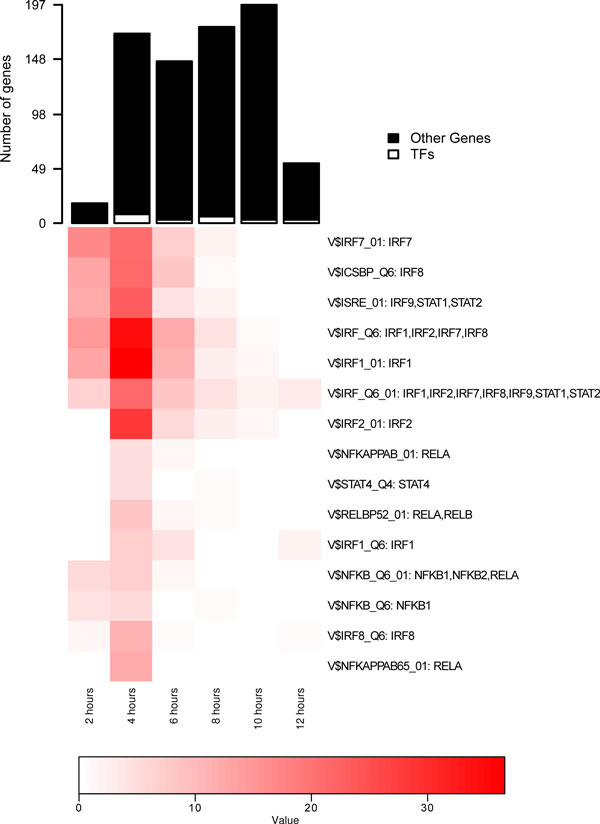
Figure 1.
Enrichment profiles for TFs implicated in the influenza response. Top panel shows numbers of genes first up-regulated at each time-point, split by TF and non-TF genes. Bottom panel shows a heatmap plot with the over-representation analysis of targets associated with TRANSFAC matrices (rows) over time (columns). Only matrices with inferred activity are pictured, and the color (-log(P-value)) indicates the significance of the hypergeometric test. The associations between a TRANSFAC matrix and the individual (up-regulated) TFs are shown to the right of the color profile.

