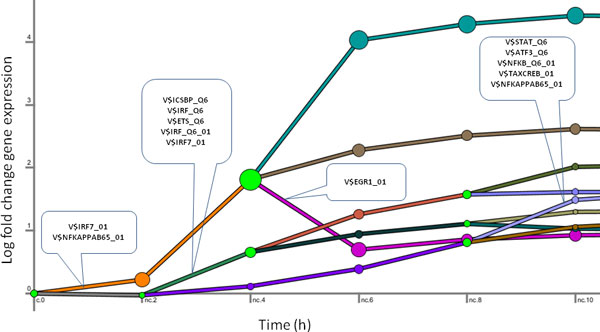
Figure 4.

Dynamic regulatory map of the influenza response. DREM [13] is used to create a dynamic map based on the time-series fold-change gene expression data as described in Methods. DREM parameters are left at their defaults. Each line in the figure represents a temporal cluster. Predicted regulatory events (cut-off of 10−3) are indicated pointing to the temporal profile immediately after the split they regulate.
