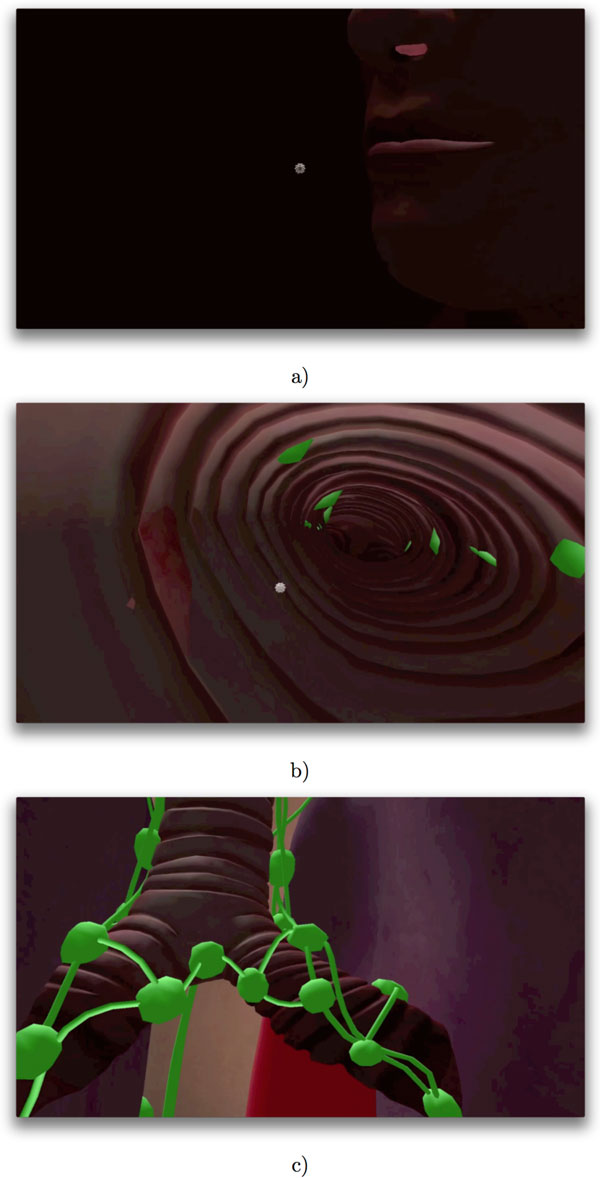
Figure 1.
Virus entry. The computer model with the airborne Influenza A virus in the context of the LINDSAY Virtual Human model. This diagram illustrates the entry of the virus via the nasal cavity (a), into the upper respiratory tract of a host (b). The green shapes represent lymph nodes in the vicinity of the upper respiratory tract (c).

