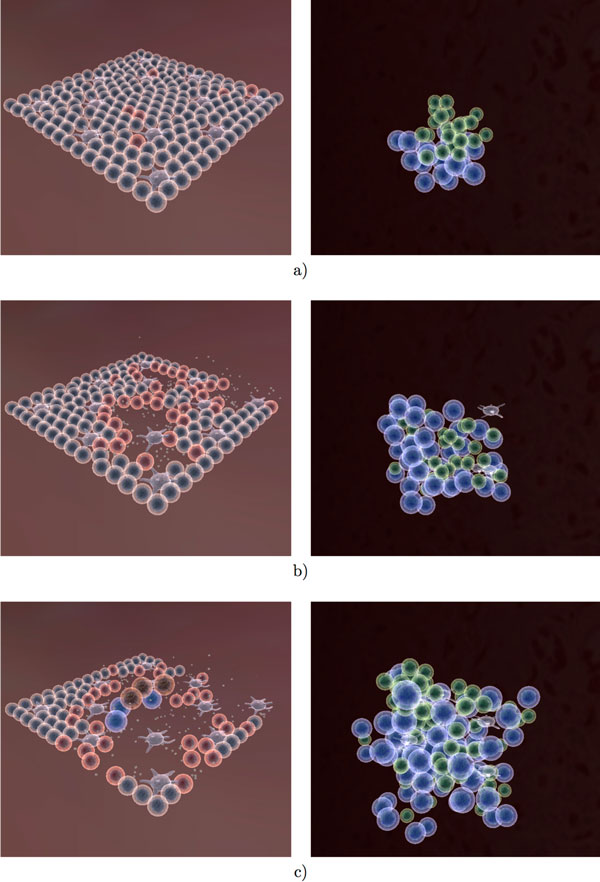
Figure 11.
Visualization of the immune response to influenza A infection (Part 1). Agent interactions in both tissue (left) and lymph node (right) as a result of infection with the Influenza A virus. (a) The virus has just infected the tissue cells into the lung, where red cells represent infected cells. At the same time, there is not yet any immune activity in the lymph node. (b,c) As the infection progresses, the immune response can be observed both in the tissue (cell-mediated) and in the lymph node (humoral).

