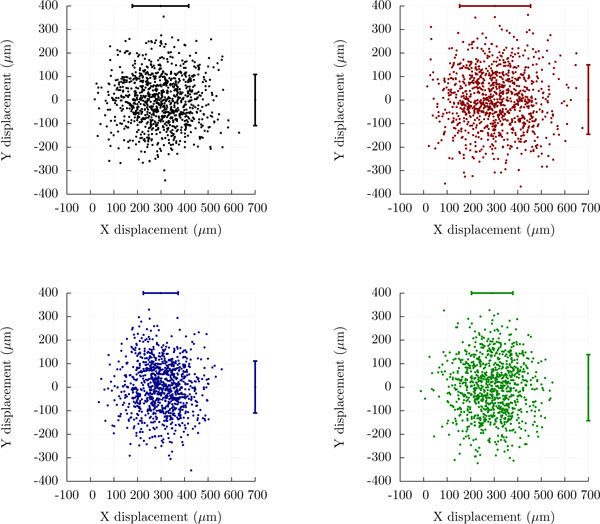
Figure 7.
Taxis skews the random motility component. Displacement of in silico cells when applying the four different methods of simulating biased migration along the X axis using the methods discussed in this paper, i.e., the simple phenomenological model (black), orthotaxis (red), topotaxis (blue), and klinotaxis (green). For each panel, N = 1000 cells were simulated using the parameters tpause = 0.5 min, tfree = 2.0 min, and vfree = 18.8 μm/min. Cell displacements are shown after one hour of simulation time, and the taxis parameters p are in each case set such that the expected displacement is 300 μm per hour. The length of the scale bars is proportional to the dimension-wise variances of the cell displacements, demonstrating that these variances change when biased migration is introduced.

