
Figure 1.
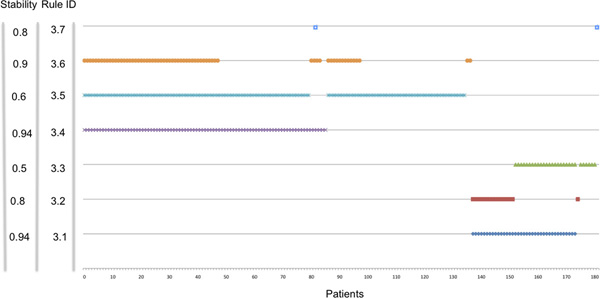
Patients representation in the rules of Table 3. Plot of the membership of the 182 patients (x axis) to the rules of the classifier in Table 3. Each patient in our dataset is covered by at least one rule.
Official websites use .gov
A
.gov website belongs to an official
government organization in the United States.
Secure .gov websites use HTTPS
A lock (
) or https:// means you've safely
connected to the .gov website. Share sensitive
information only on official, secure websites.
Patients representation in the rules of Table 3. Plot of the membership of the 182 patients (x axis) to the rules of the classifier in Table 3. Each patient in our dataset is covered by at least one rule.