Figure 4.

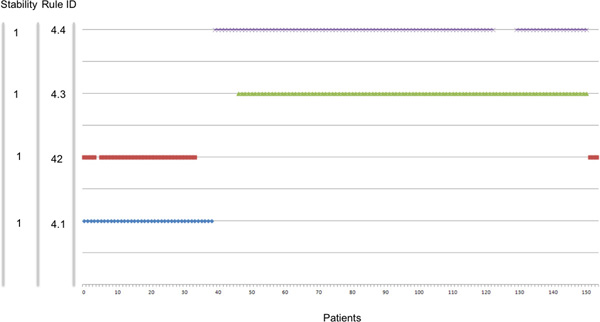
Final classifier. Plot of the membership of the 154 patients remaining in the dataset after purge (x axis) to the rules of the classifier in Table 4 (y axis). The stability of each rule is listed along the y axis.

Final classifier. Plot of the membership of the 154 patients remaining in the dataset after purge (x axis) to the rules of the classifier in Table 4 (y axis). The stability of each rule is listed along the y axis.