Figure 5.

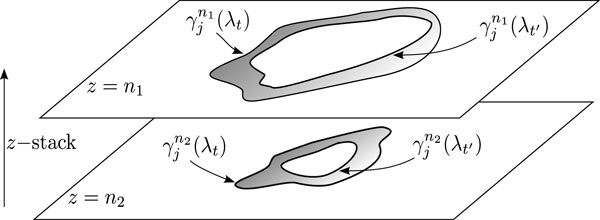
Model parameters. Graphical representation of two segmented regions representing the regions of GC shown on two different slices n1 and n2 used for defining the objective function for automatically optimizing the input parameter λ.

Model parameters. Graphical representation of two segmented regions representing the regions of GC shown on two different slices n1 and n2 used for defining the objective function for automatically optimizing the input parameter λ.