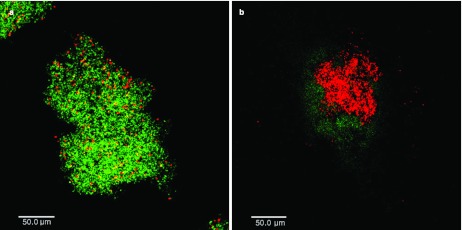
Figure 4.

CLSM images of biofilms at 12 h incubation time in 0.1% sucrose. Green fluorescence represents viable bacteria and red fluorescence represents affected bacteria. (a) Group 1: non-treated biofilms with PDT. (b) Group 4: treated biofilms with PDT. The scale bar for (a) and (b) is 50 µm. CLSM, confocal laser scanning fluorescence microscopy; PDT, photodynamic therapy.
