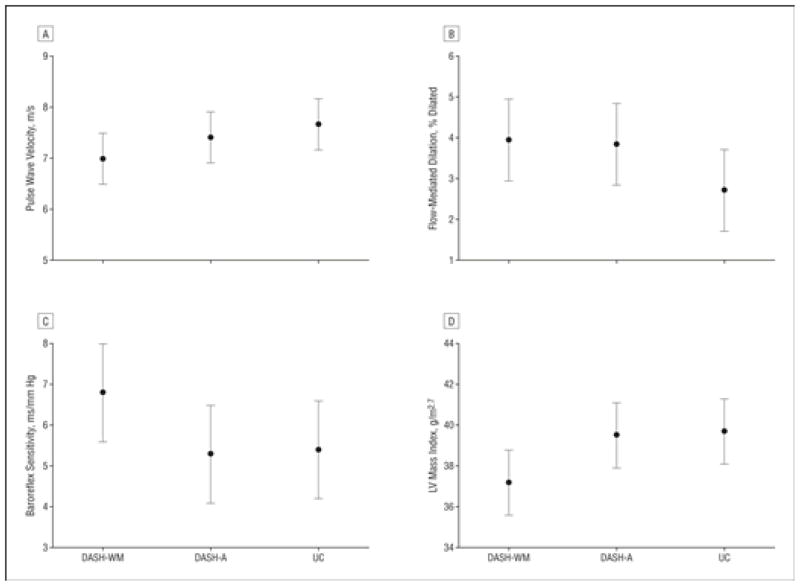
Figure 4.
Comparison of posttreatment mean (95% confidence interval) values for pulse wave velocity (A), flow-mediated dilation (B), baroreflex sensitivity (C), and left ventricular (LV) mass index (D) by treatment group, adjusted for age, sex, ethnicity, and pretreatment level of response variable. Flow-mediated dilation of the brachial artery also was adjusted for pretreatment arterial diameter at rest. Results of contrasts were as follows: for pulse wave velocity (A), all treatments vs usual diet controls (UC), P = .002, and DASH-WM (Dietary Approaches to Stop Hypertension plus weight management) vs DASH-A (DASH alone), P = .045; for flow-mediated dilation (B), all treatments vs UC, P = .06, and DASH-WM vs DASH-A, P = .99; for baroreflex sensitivity (C), all treatments vs UC, P = .38, and DASH-WM vs DASH-A, P = .01; and for left ventricular mass index (D), all treatments vs UC, P = .26, and DASH-WM vs DASH-A, P = .02.

