Figure 8.
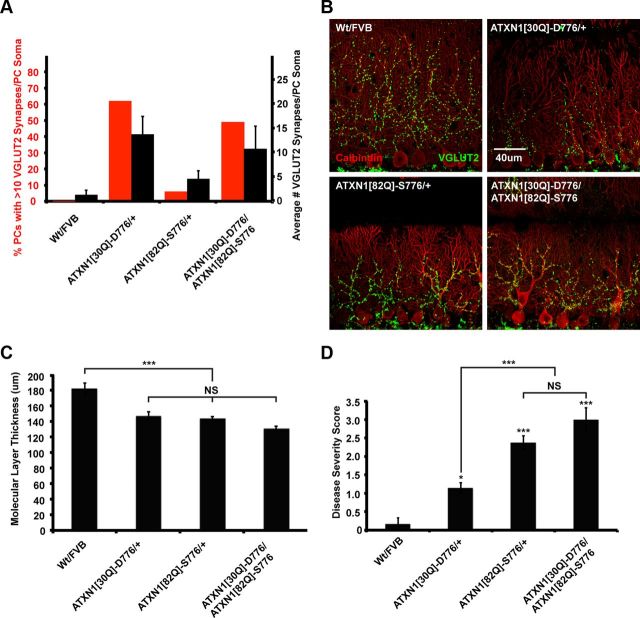
Mice expressing both ATXN1[30Q]-D776 and ATXN1[82Q]-S776 display increased severity of disease at 9 months of age. A, Graph shows number of PCs with >10 VGLUT2 synapses (left axis, red bars) and average number of VGLUT2 synapses per PC soma (right axis, black bars) in mice 5 weeks of age. ATXN1[30Q]-D776/ATXN1[82Q]-S776 PC somata retain VGLUT2 synapses to a similar extent see in ATXN1[30Q]-D776/+ mice. Greater than three mice were used for each genotype; Wt FVB: n = 74 PCs examined; ATXN1[30Q]-D776/+: n = 52; ATXN1[82Q]-S776/+: n = 73; ATXN1[30Q]-D776/ATXN1[82Q]-S776: n = 50. B, 60× immunofluorescent images of calbindin-labeled PCs (red) and VGLUT2-labeled CF synapses (green). C, Graph shows the average molecular thickness. Wt FVB: N = 5 mice; ATXN1[30Q]-D776/+: N = 7; ATXN1[82Q]-S776/+: N = 8; ATXN1[30Q]-D776/ATXN1[82Q]-S776: N = 6. D, Graph of pathological severity score. Wt FVB: N = 5 mice; ATXN1[30Q]-D776/+: N = 7; ATXN1[82Q]-S776/+: N = 8; ATXN1[30Q]-D776/ATXN1[82Q]-S776: N = 6. *p < 0.05, **p < 0.01, ***p < 0.001.

