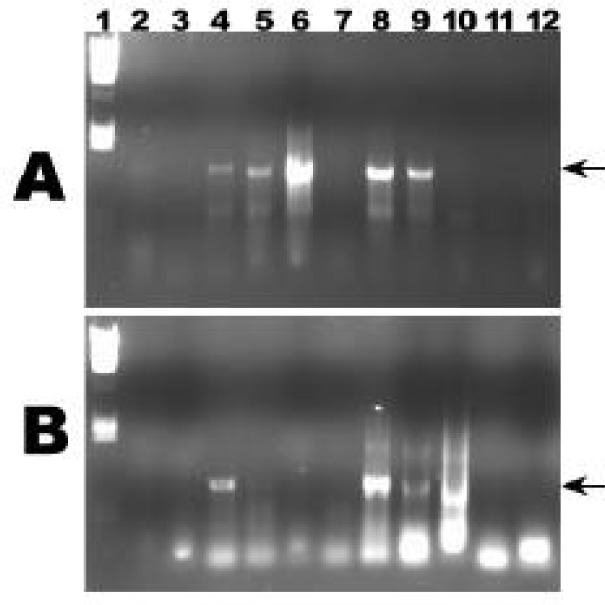
FIG. 3.
Representative PCR data. Panel A was generated using general bacterial 16S primers. Panel B was generated with GNS-specific primers. Lane 1 in both A and B is marker standards (Lambda/HindIII), and lanes 2 through 12 were representative products using different PCR buffers. The arrows at the right indicate the target fragment. PCR product was separated using 1% agarose with standard TAE running buffer.

