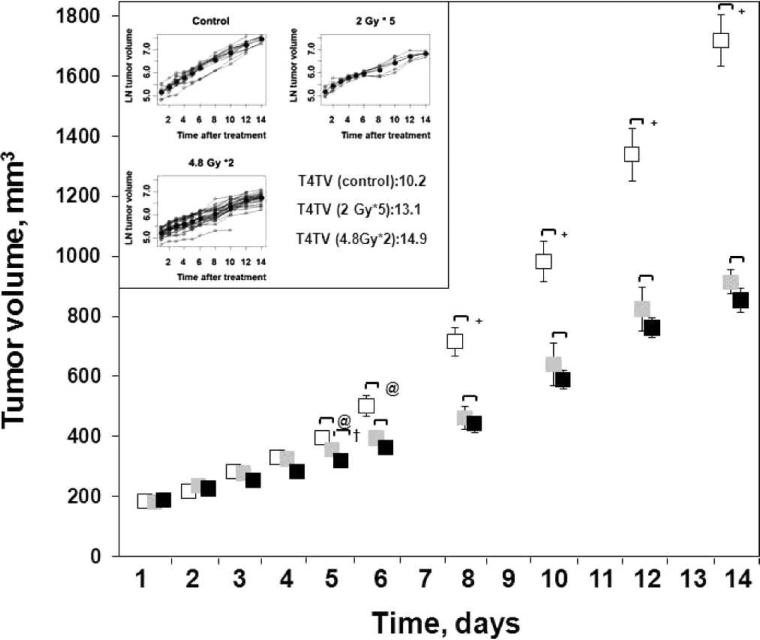
FIG. 5.
The changes in the C6 glioma growth in (white symbol) 0 Gy (M, N = 11), (black symbol) 4.8 Gy ×; 2 (K, N = 24) and (gray symbol) 2 Gy × 5 (L, N = 7) groups. Inset: Days to reach 4× the original tumor volume (T4TV) of groups M, K and L. The line in bold represents the mean data obtained from individual values on each day. Mean ± SEM, @P < 0.05, +P < 0.01, compared with the control group; †P < 0.05, compared with group L.

