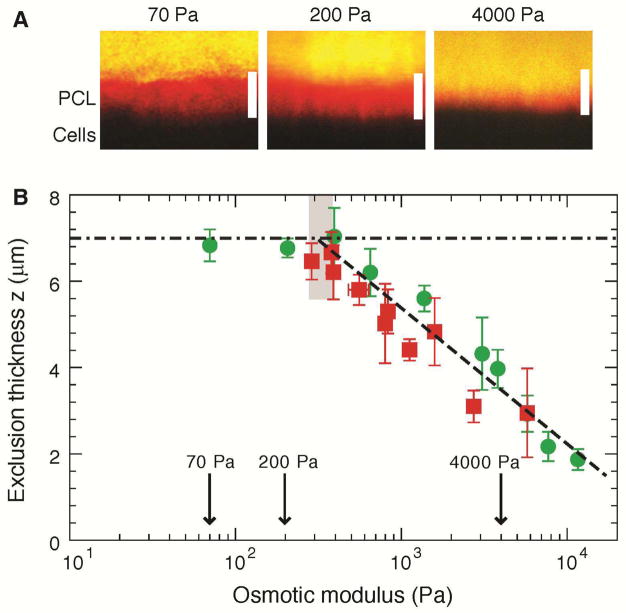
Fig. 4. Osmotic compression of the PCL-brush by mucus and mucus simulants.
(A) Representative XZ-confocal images showing progressive compression of the PCL brush by large dextran molecules (d > 50 nm) of increasing osmotic moduli. Scale bars = 7 μm. (B) Summary data of the exclusion thickness (z) of the large dextran molecules (green circles) and endogenous mucus (red squares) versus their osmotic moduli. Data points are mean ± SD (n = 3–5). Dashed black line represents the best linear fit to the dependence of PCL height on the logarithm of osmotic modulus of mucus/mucus simulants for z < 6 μm: z ≈ 7μm − 3.15Log(K/340Pa). The highlighted region represents the osmotic modulus of a fully-hydrated (healthy) PCL, K0 ≈ 300±60 Pa, above which noticeable decrease of the PCL height was observed.

