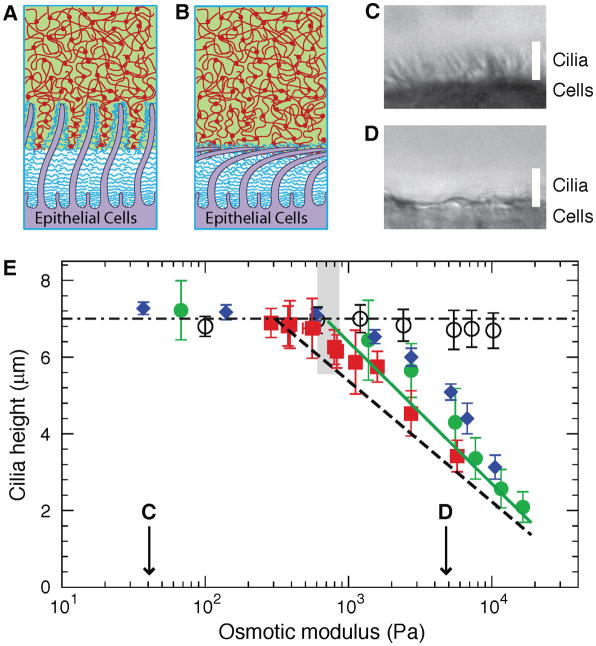
Fig. 6. Collapse of cilia by mucus and mucus simulants.
Possible scenarios for the compression of the PCL brush by mucus or mucus simulants with high osmotic modulus (concentration): (A) tethered macromolecules are compressed towards the cilia surface without significant deformation of the cilia in comparison to the uncompressed PCL brush in Fig. 2A; (B) in addition to the compressed tethered macromolecules, the cilia are also deformed by solutions with high osmotic modulus; (C, D) Representative bright-field microscopy images showing the effects of low (C; ~ 300 Pa) and high (D; ~ 5,000 Pa) osmotic moduli of agarose on cilia height from HBE cultures (viewed in profile). White bars denote the length of fully extended cilia (7 μm). (E) Summary plot of the cilia height versus the osmotic moduli of the overlying mucus/mucus simulants, using large, PCL-impermeable dextran (d > 50 nm; green solid circles), low-melting point agarose (d ≈ 44 nm; blue solid diamonds), endogenous mucus (red solid squares), and small PCL permeable dextran (d ≈ 2 nm; black empty circles). Data points are mean ± SD (n = 3–5). Note that the PCL-permeant 2 nm dextran did not alter the height of the cilia. “C” and “D” above the x-axis represent conditions illustrated above. Solid green line represents the best linear fit to the dependence of cilia height on the logarithm of osmotic modulus of mucus/mucus simulants for K > 1,000 Pa: z ≈ 7μm − 3.33Log(K/807Pa). Dependence of the exclusion zone z(K) on osmotic modulus of mucus/mucus simulants (Fig. 4B) is shown for comparison by the dashed black line. Highlighted zone represents the crossover osmotic modulus, Kcc ≈ 800±120 Pa, above which noticeable decrease of the cilia height was observed.

