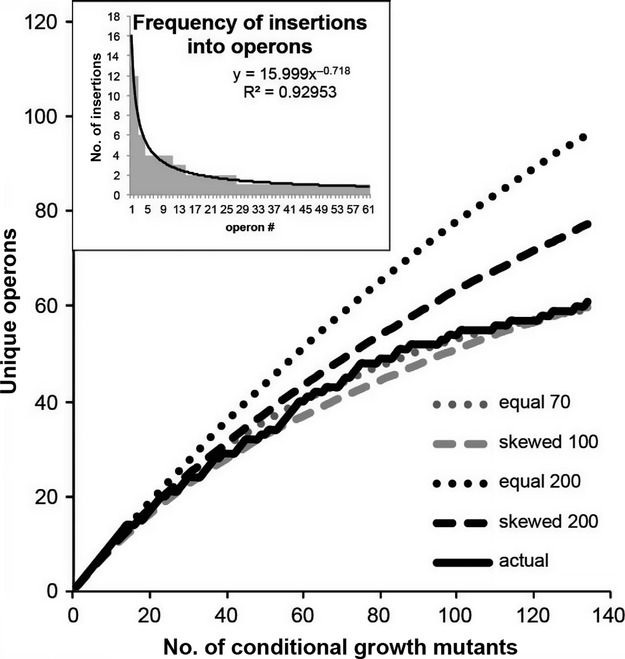
Figure 5.

The rate at which new operons were discovered. The rate at which unique operons were discovered experimentally (actual) is compared with four simulations averaging 100 trials of 200, 100, or 70 essential operons, assuming either that every essential operon is equally likely to be detected (equal) or that the observed frequency distribution applies to all essential operons (skewed). The inset shows the frequency at which essential operons were discovered experimentally.
