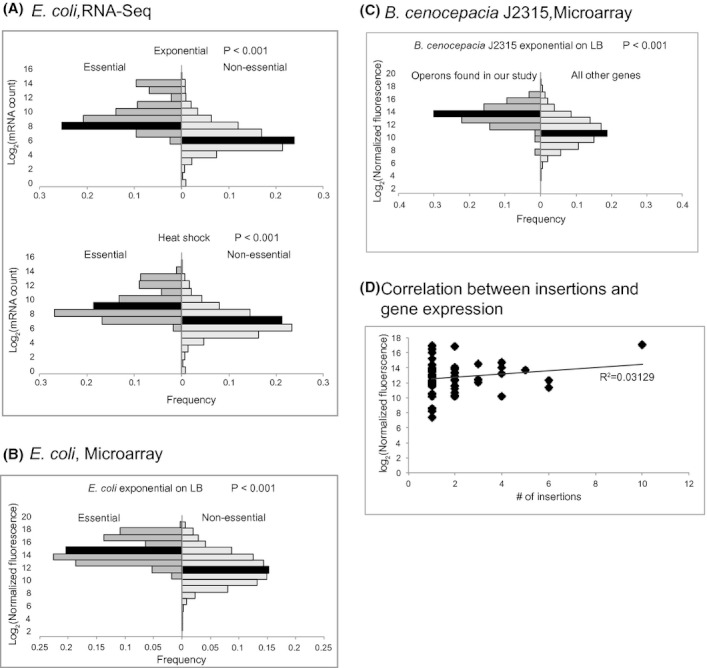
Figure 6.

The distribution of gene expression in putatively essential and nonessential genes. The black bars contain the median level of gene expression for each class. The distribution of expression between essential and nonessential genes for each species/condition/methodology was compared using a Mann–Whitney test. Median values, U statistic, and number (n) of essential and nonessential genes are as follows. (A) Exponentially growing cells (median mRNA transcripts: 364.7 essential, 51.8 nonessential, U = 893,584, P < 0.001), heat-shock treatment (median mRNA transcripts: 294 essential, 69.3 nonessential, U = 786,268, P < 0.001) nnonessential = 4038, nessential = 280; (B) cDNA microarray for exponentially growing cells (median fluorescence: 16,700.09 essential, 3328.65 nonessential, U = 701,538, nessential = 280, nnonessential = 3868, P < 0.001); (C) cDNA microarray for Burkholderia cenocepacia J2315 (median fluorescence: 10,448.6 operons in library, 1864.7 other genes, U = 346,475, nessential = 6875, nnonessential = 63, P < 0.001); (D) There is no correlation between levels of gene expression and the frequency at which insertions into an operon were recovered.
