
Figure 1.
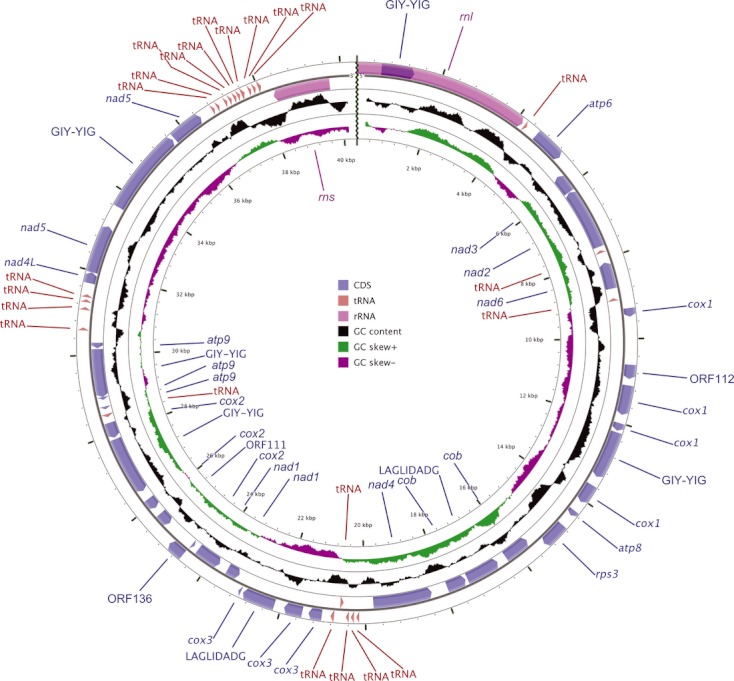
Physical map of the Rhodotorula taiwanensis RS1 mitochondrial genome. From the outside in, the various rings represent (i) R. taiwanensis RS1 genes identified in the clockwise strand; (ii) genes identified in the anti-clockwise strand; (iii) G+C content as the deviation from the average over the entire genome; and (iv) G+C skew as the deviation from the average over the entire genome. Unannotated open reading frames (ORFs) longer than 100-codons are depicted with the number of their corresponding amino acids in the labels. The image was generated by using CGVIEW (Grant and Stothard 2008).