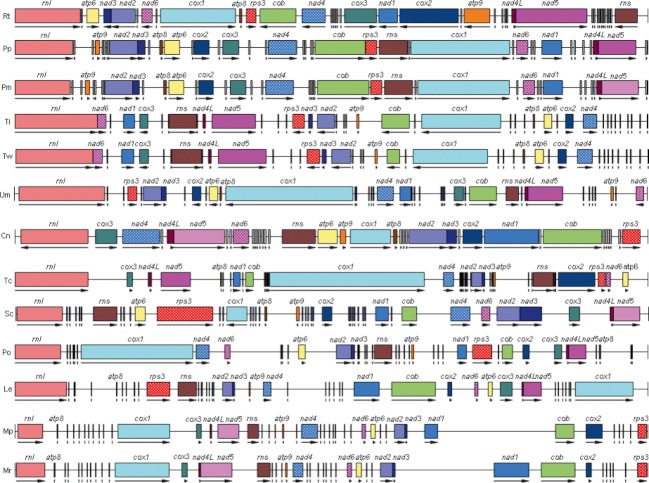
Figure 2.
Comparison of the gene content and order of the known mitochondrial genomes from Basidiomycota. This map was drawn by using the PlasDraw software contained in GENETYX version 10. Abbreviations are the same as in Table 1. Gene sizes and total mitochondrial genome length were drawn to match those of the genome of Rhodotorula taiwanensis RS1. Black vertical lines represent tRNAs that were not labeled.

