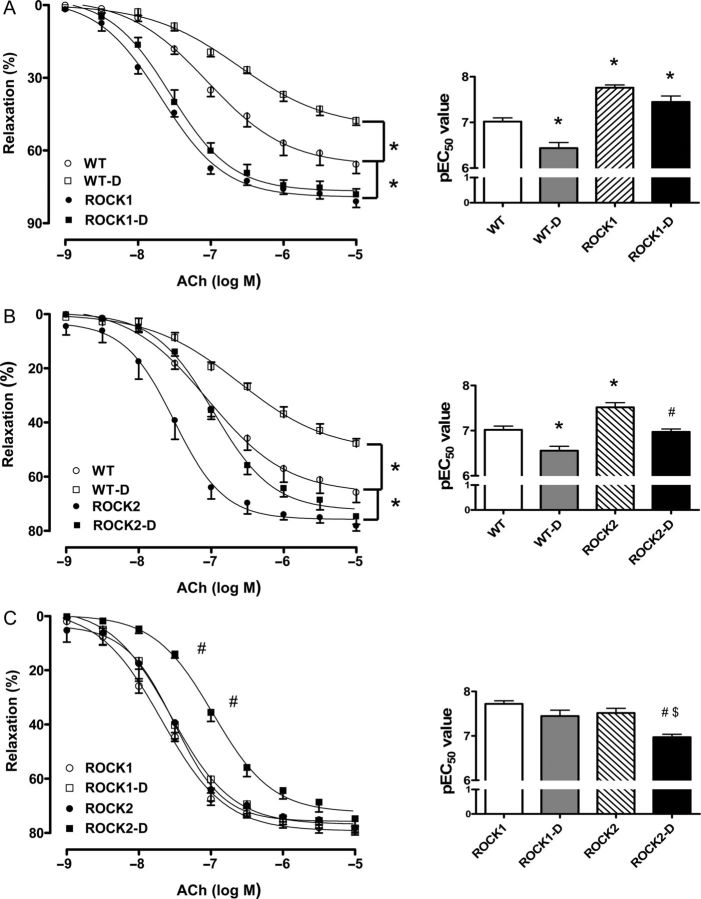
Figure 3.
Endothelium-dependent vasorelaxation in aortas of WT, ROCK1+/− (ROCK1) and ROCK2+/− (ROCK2) control, and diabetic (D) mice. Endothelium-mediated relaxation to ACh (10−9 to 10−5M) was assessed in aortic rings from all groups. (A–C) Comparisons between genotypes. Data were calculated as changes from the contraction produced by PE (10−7 to 10−6 M) in each tissue, which was taken as 100%. To the right side of each relaxation curve are pEC50 values (negative logarithm of the concentration of ACh effective in producing 50% of the maximum relaxation). Data are represented as means ± SEM, n = 5–8 mice/group. *P < 0.05 vs. WT control mice; #P < 0.05 vs. ROCK2 control mice; $P < 0.05 vs. ROCK1-D mice.

