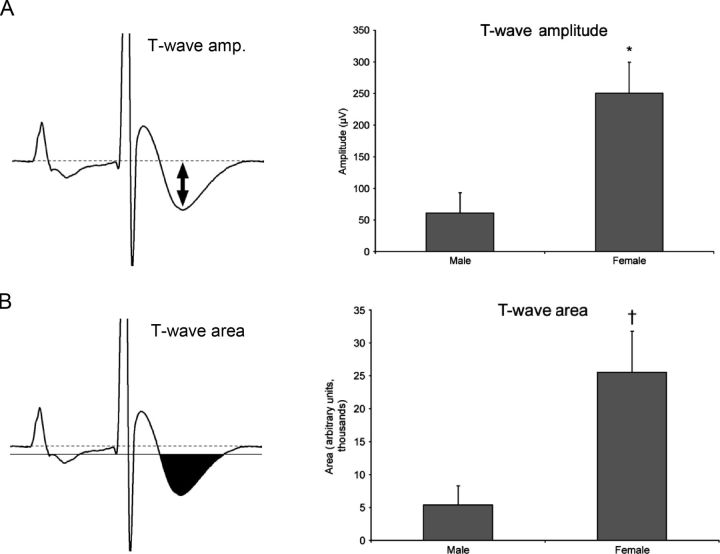
Figure 2.
QT measurement in male and female mice after ATX-II injection. (A) T wave amplitude measurement is marked with a double-headed arrow. (B) Quantification of the T wave is performed by marking the T90 area and counting pixels within the region. †P < 0.05, *P < 0.01. ATX-II treatment produced much greater changes in both indices of repolarization in female compared with male animals.

